
|
DOCUMENTATION_FORMAT: Man_Made
SAMPLE_ID: GDS918
MATERIAL_TYPE: Expanded Phyllosilicates
MATERIAL: Expanded Vermiculite Ore
FORMULA: (Mg,Fe2+,Al)3(Si,Al)4O10(OH)2.4H2O
FORMULA_HTML: (Mg,Fe2+,Al)3(Si,Al)4O10(OH)2.4H2O
COLLECTION_LOCALITY: This sample came from a bag of Strong-Lite® attic insulation from Arlington Heights, Illinois supplied by the U.S. EPA in 2005.
ORIGINAL_DONOR: U.S. EPA
CURRENT_SAMPLE_LOCATION: USGS Denver, CO
ULTIMATE_SAMPLE_LOCATION: USGS Denver, CO
SAMPLE_DESCRIPTION:
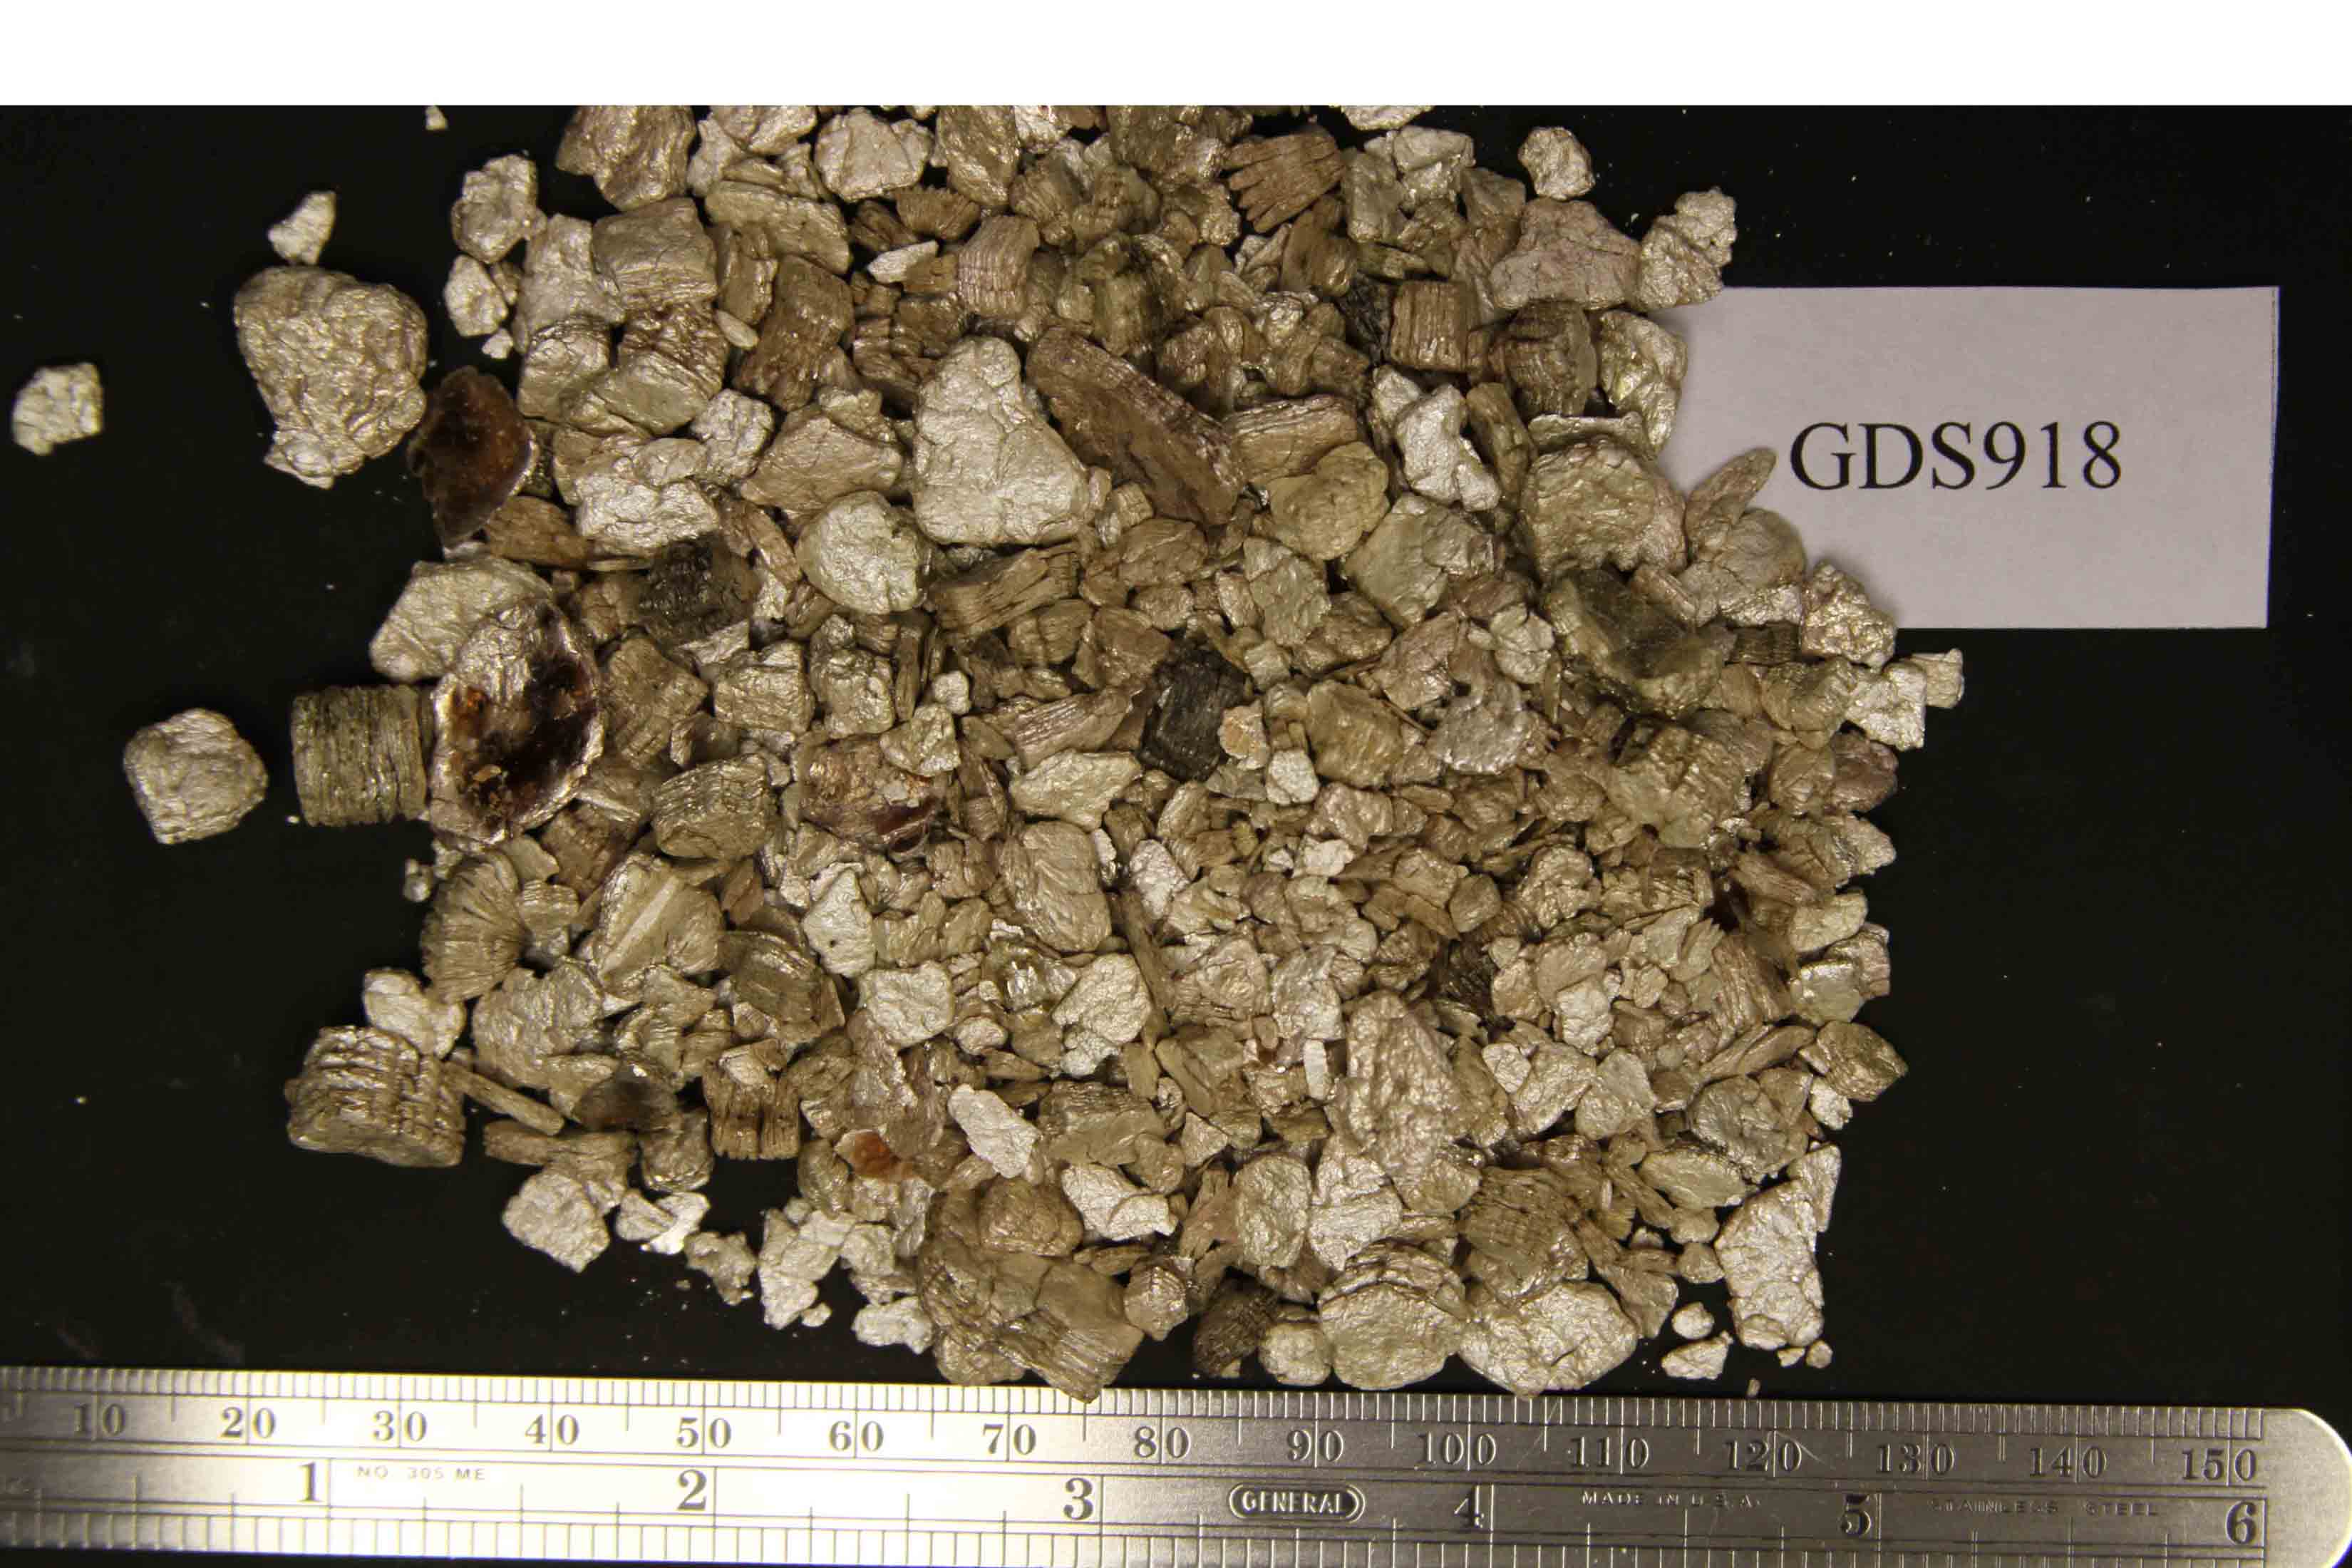
The sample has a mottled golden color and ranges in grain size from 1 – 10 mm with an average around 7 mm (Fig. GDS918.photo.1).
A modified Cincinnati floation method was carried out on this sample. The sink fraction consists of mica flakes and small elongate amphibole bundles, the later of which were mounted on a stub for SEM examination.
The sample has a spectral signature similar to that of expanded vermiculite ore from the Palabora Mine, Phalaborwa, South Africa.
Original spectrum published in:
IMAGE_OF_SAMPLE:
END_SAMPLE_DESCRIPTION.
XRD_ANALYSIS:
No XRD analysis is available for this sample.
END_XRD_ANALYSIS.
COMPOSITIONAL_ANALYSIS_TYPE: None # XRF, EPMA, ICP(Trace), WChem
COMPOSITION_TRACE: None
COMPOSITION_DISCUSSION:
The sample was examined with probe microanalysis. Spot analyses plot in the Palabora field on the Al/Ti versus Al/[Mg/(Mg+Fe)] diagram (Fig. GDS918.microprobe.1).
END_COMPOSITION_DISCUSSION.
MICROSCOPIC_EXAMINATION:
The sample was examined with SEM and Energy dispersive spectroscopy. Particles from the sink fraction were placed on an SEM stub, which was coated with carbon, and examined under high magnification (Figs. GDS918.EDS.1 to 12 and GDS918.SEM.1 to 5). No amphibole, talc, or serpentine grains were found.
END_MICROSCOPIC_EXAMINATION.
SPECTROSCOPIC_DISCUSSION:
This spectrum is typical for a sample with predominately hydrobiotite and phlogopite/biotite. The 1.40/1.42 micron band depth ratio plots just below the “no detectable amphibole, talc, and serpentine” line in Figures GDS918.spectrum.2 and 3. This reflectance spectrum of this sample does not have a detectable 2.24-micron band so there is no symbol on Fig. GDS918.spectrum.4. The spectral parameters plot in the Palabora field (Figs. GDS918.spectrum.2 and 3).
SPECTRAL_PURITY: 1b2_3_4_ # 1= 0.2-3, 2= 1.5-6, 3= 6-25, 4= 20-150 microns