
|
DOCUMENTATION_FORMAT: Man_Made
SAMPLE_ID: GDS876
MATERIAL_TYPE: Expanded Phyllosilicates
MATERIAL: Expanded Vermiculite Ore
FORMULA: (Mg,Fe2+,Al)3(Si,Al)4O10(OH)2.4H2O
FORMULA_HTML: (Mg,Fe2+,Al)3(Si,Al)4O10(OH)2.4H2O
COLLECTION_LOCALITY: This sample was collected as packing in a box used to send chemical reagents to the U.S. Geological Survey in Denver, Colorado in 2009.
ORIGINAL_DONOR:
CURRENT_SAMPLE_LOCATION: USGS Denver, CO
ULTIMATE_SAMPLE_LOCATION: USGS Denver, CO
SAMPLE_DESCRIPTION:
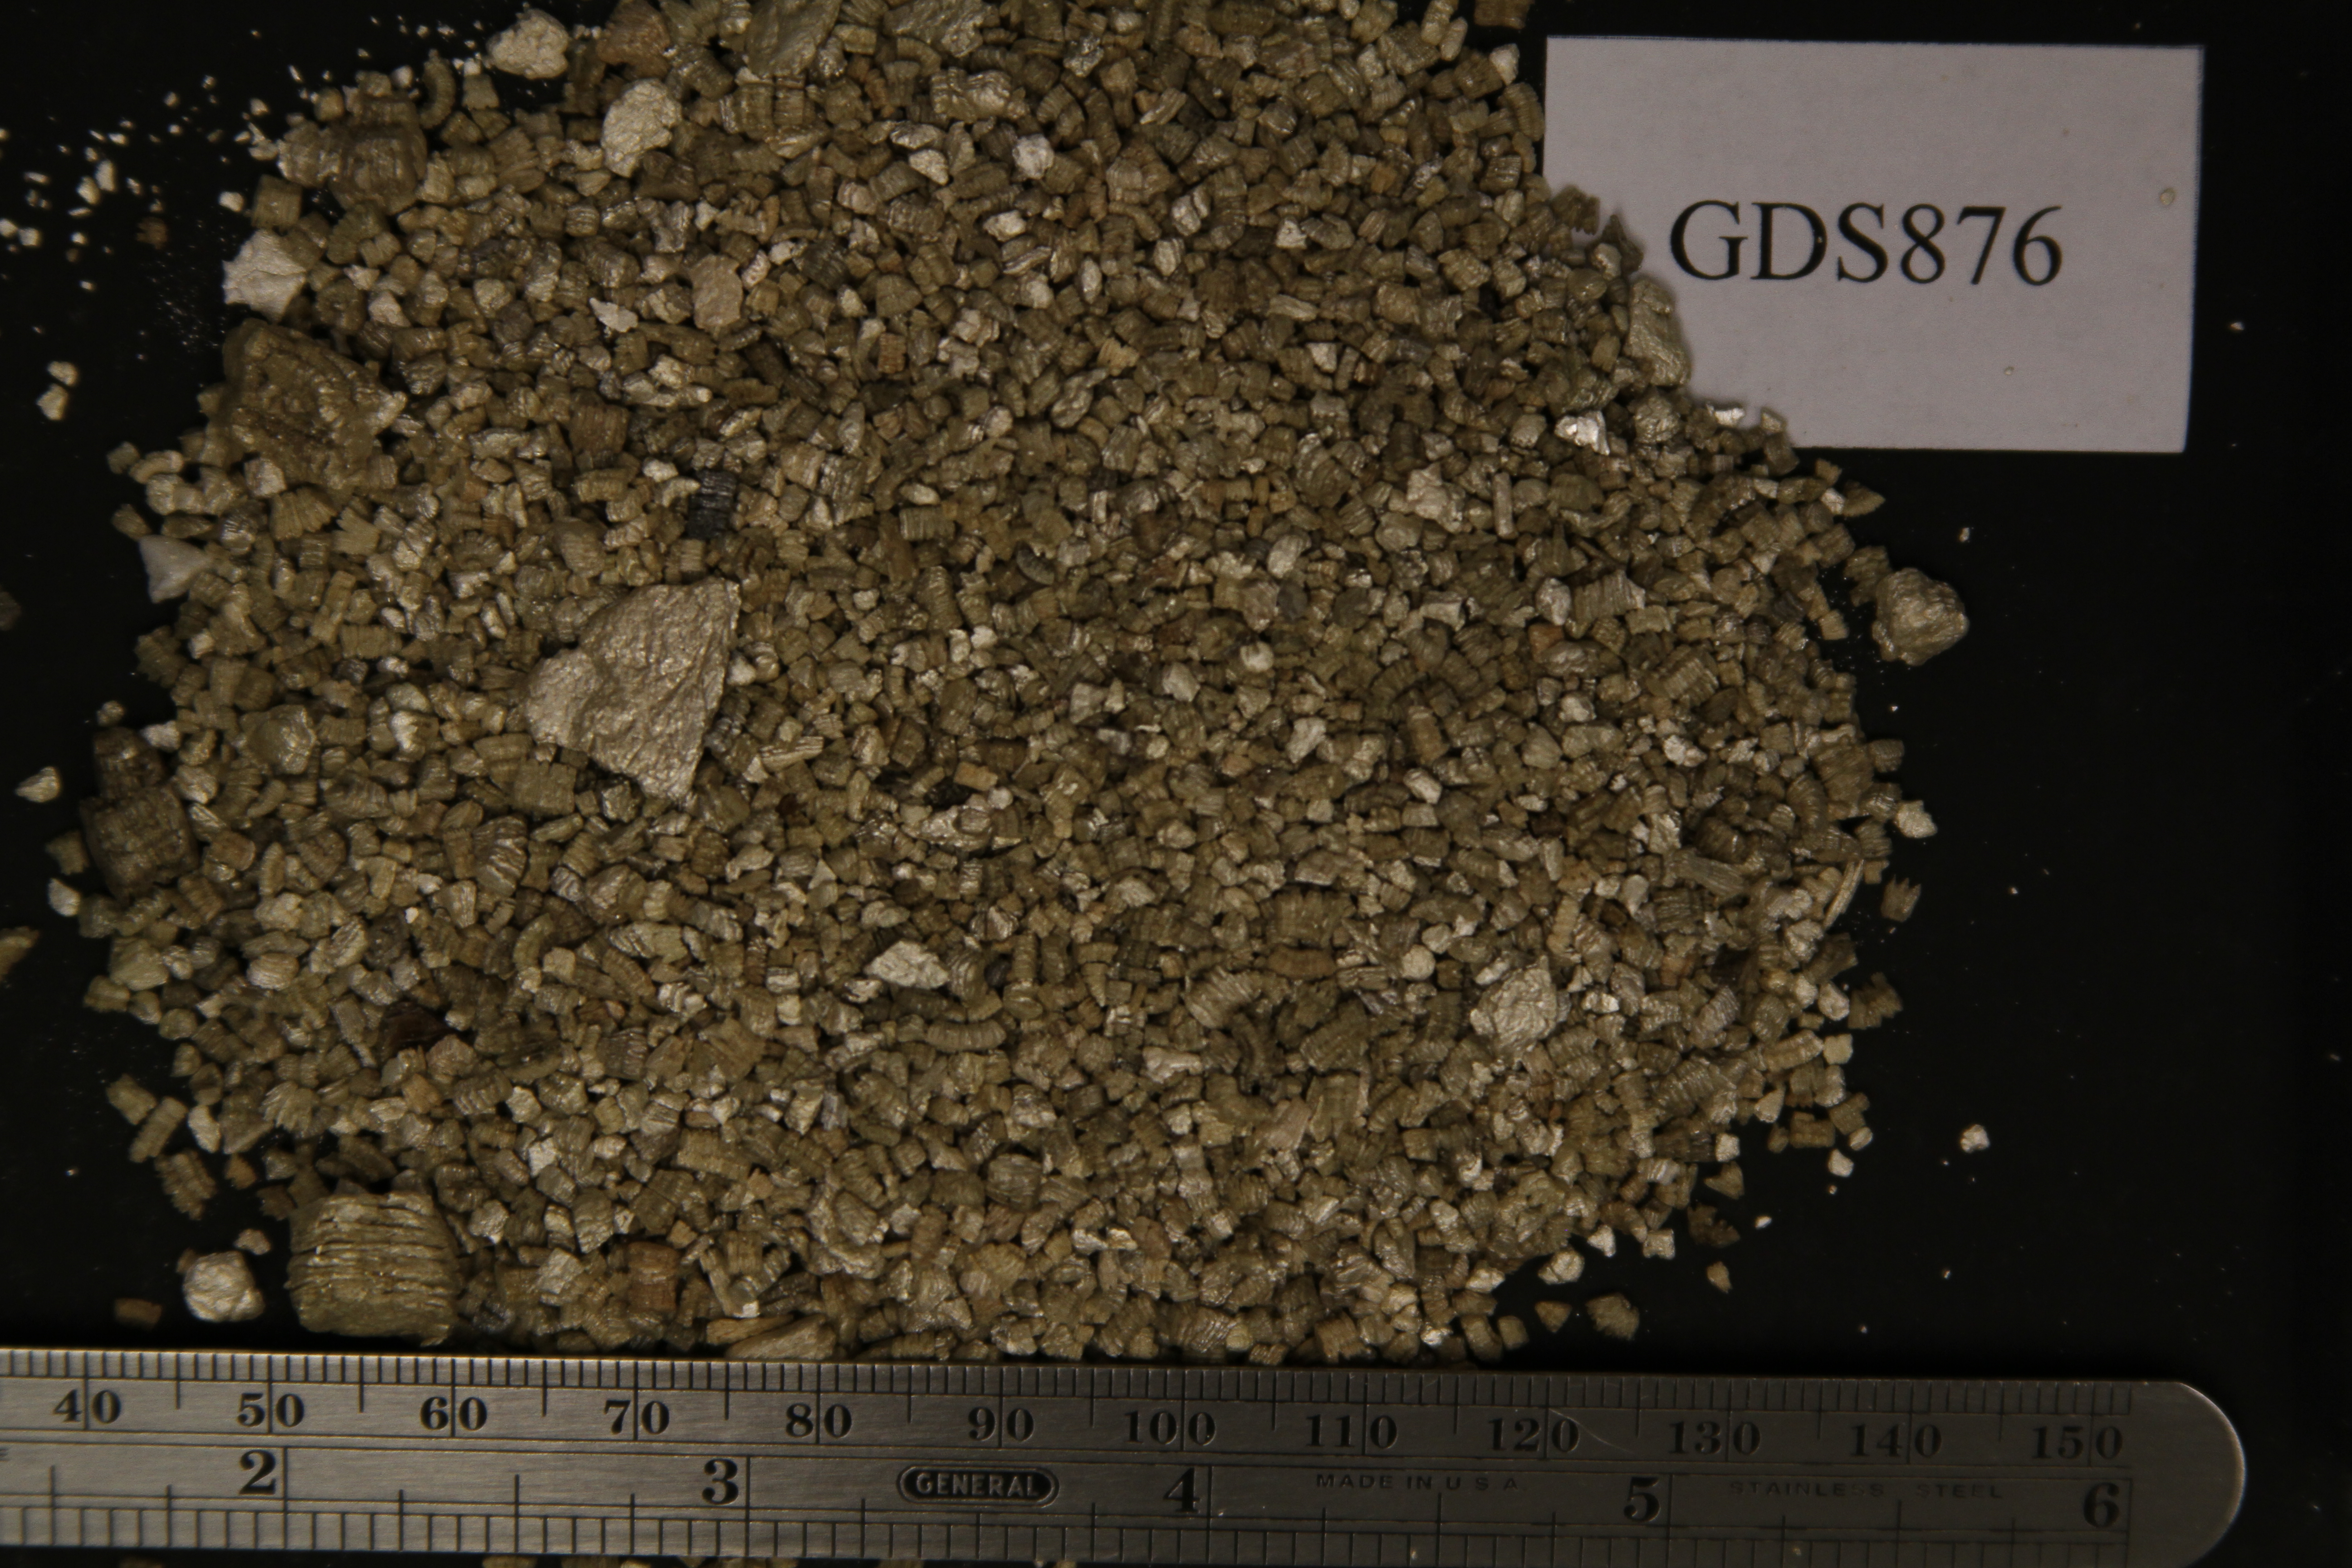
The sample has a mottled golden color with a few dark grains. Grains range in size from 2 – 4 mm with occasional grains up to 13 mm (Fig. GDS876.photo.1).
A modified Cincinnati floation method was carried out on this sample. The sink fraction consists of mica flakes and small particles that were mounted on a stub for SEM examination.
The sample has a spectral signature of a mixture of vermiculite from the Palabora Mine, Phalaborwa, South Africa and an unknown source similar to GDS836.
Original spectrum published in:
IMAGE_OF_SAMPLE:
END_SAMPLE_DESCRIPTION.
XRD_ANALYSIS:
No XRD analysis is available for this sample.
END_XRD_ANALYSIS.
COMPOSITIONAL_ANALYSIS_TYPE: None # XRF, EPMA, ICP(Trace), WChem
COMPOSITION_TRACE: None
COMPOSITION_DISCUSSION:
The sample was examined with probe microanalysis. Spot analyses plot in the Palabora field on the Al/Ti versus Al/[Mg/(Mg+Fe)] diagram (Fig. GDS876.microprobe.1). One spot analysis plots at the top center of the diagram, indicating the presence of a foreign source of vermiculite.
END_COMPOSITION_DISCUSSION.
MICROSCOPIC_EXAMINATION:
The sample was examined with SEM and Energy dispersive spectroscopy. Prticles from the sink fraction were placed on an SEM stub, which was coated with carbon, and examined under high magnification. Points analyzed with EDS are shown in color on SEM micrographs that accompany the EDS spectra. Numerous elongate compositionally <93>Libby-like<94> amphibole particles were detected with EDS and SEM analyses (e.g., Figs. GDS876.EDS.1 and 2, and Fig. GDS876.SEM.1 and 2). The elongate amphibole particles in this sample are notably less elongate (i.e., they are byssolite like) compared to those in vermiculite samples from Libby, Montana (compare with Figs. at1UI.SEM.1, GDS332.SEM.2, GDS652.SEM.2, GDS653.SEM.1, and GDS701.SEM.2). These elongate amphibole particles are remarkably similar in morphology and composition to those present in sample expanded vermiculite sample GDS836, which is also considered to be from an uknown source (compare Figs. GDS876.SEM.2 with GDS836.SEM.1), suggesting they are from the same foreign source.
END_MICROSCOPIC_EXAMINATION.
SPECTROSCOPIC_DISCUSSION:
The spectrum is typical for a sample with predominately hydrobiotite and phlogopite/biotite. The 1.40/1.42 micron band depth ratio plots above the “no detectable amphibole, talc, and serpentine” line in Figures GDS876.spectrum.2. The reflectance spectrum of this sample has a detectable 2.24-micron band so its symbol plots just left of the Libby field above the mixtures field on Fig. GDS876.spectrum.4. The spectral parameters plot in the Mixtures field (Figs. GDS876.spectrum.2 and 3).
SPECTRAL_PURITY: 1b2_3_4_ # 1= 0.2-3, 2= 1.5-6, 3= 6-25, 4= 20-150 microns