
|
DOCUMENTATION_FORMAT: Man_Made
SAMPLE_ID: GDS836
MATERIAL_TYPE: Expaned Phyllosilicates
MATERIAL: Expanded Vermiculite Ore
FORMULA: (Mg,Fe2+,Al)3(Si,Al)4O10(OH)2.4H2O
FORMULA_HTML: (Mg,Fe2+,Al)3(Si,Al)4O10(OH)2.4H2O
COLLECTION_LOCALITY: This sample came from a bag of DESAÛ Heating vermiculite purchased in the Denver, Colorado area around 2008.
ORIGINAL_DONOR:
CURRENT_SAMPLE_LOCATION: USGS Denver, CO
ULTIMATE_SAMPLE_LOCATION: USGS Denver, CO
SAMPLE_DESCRIPTION:
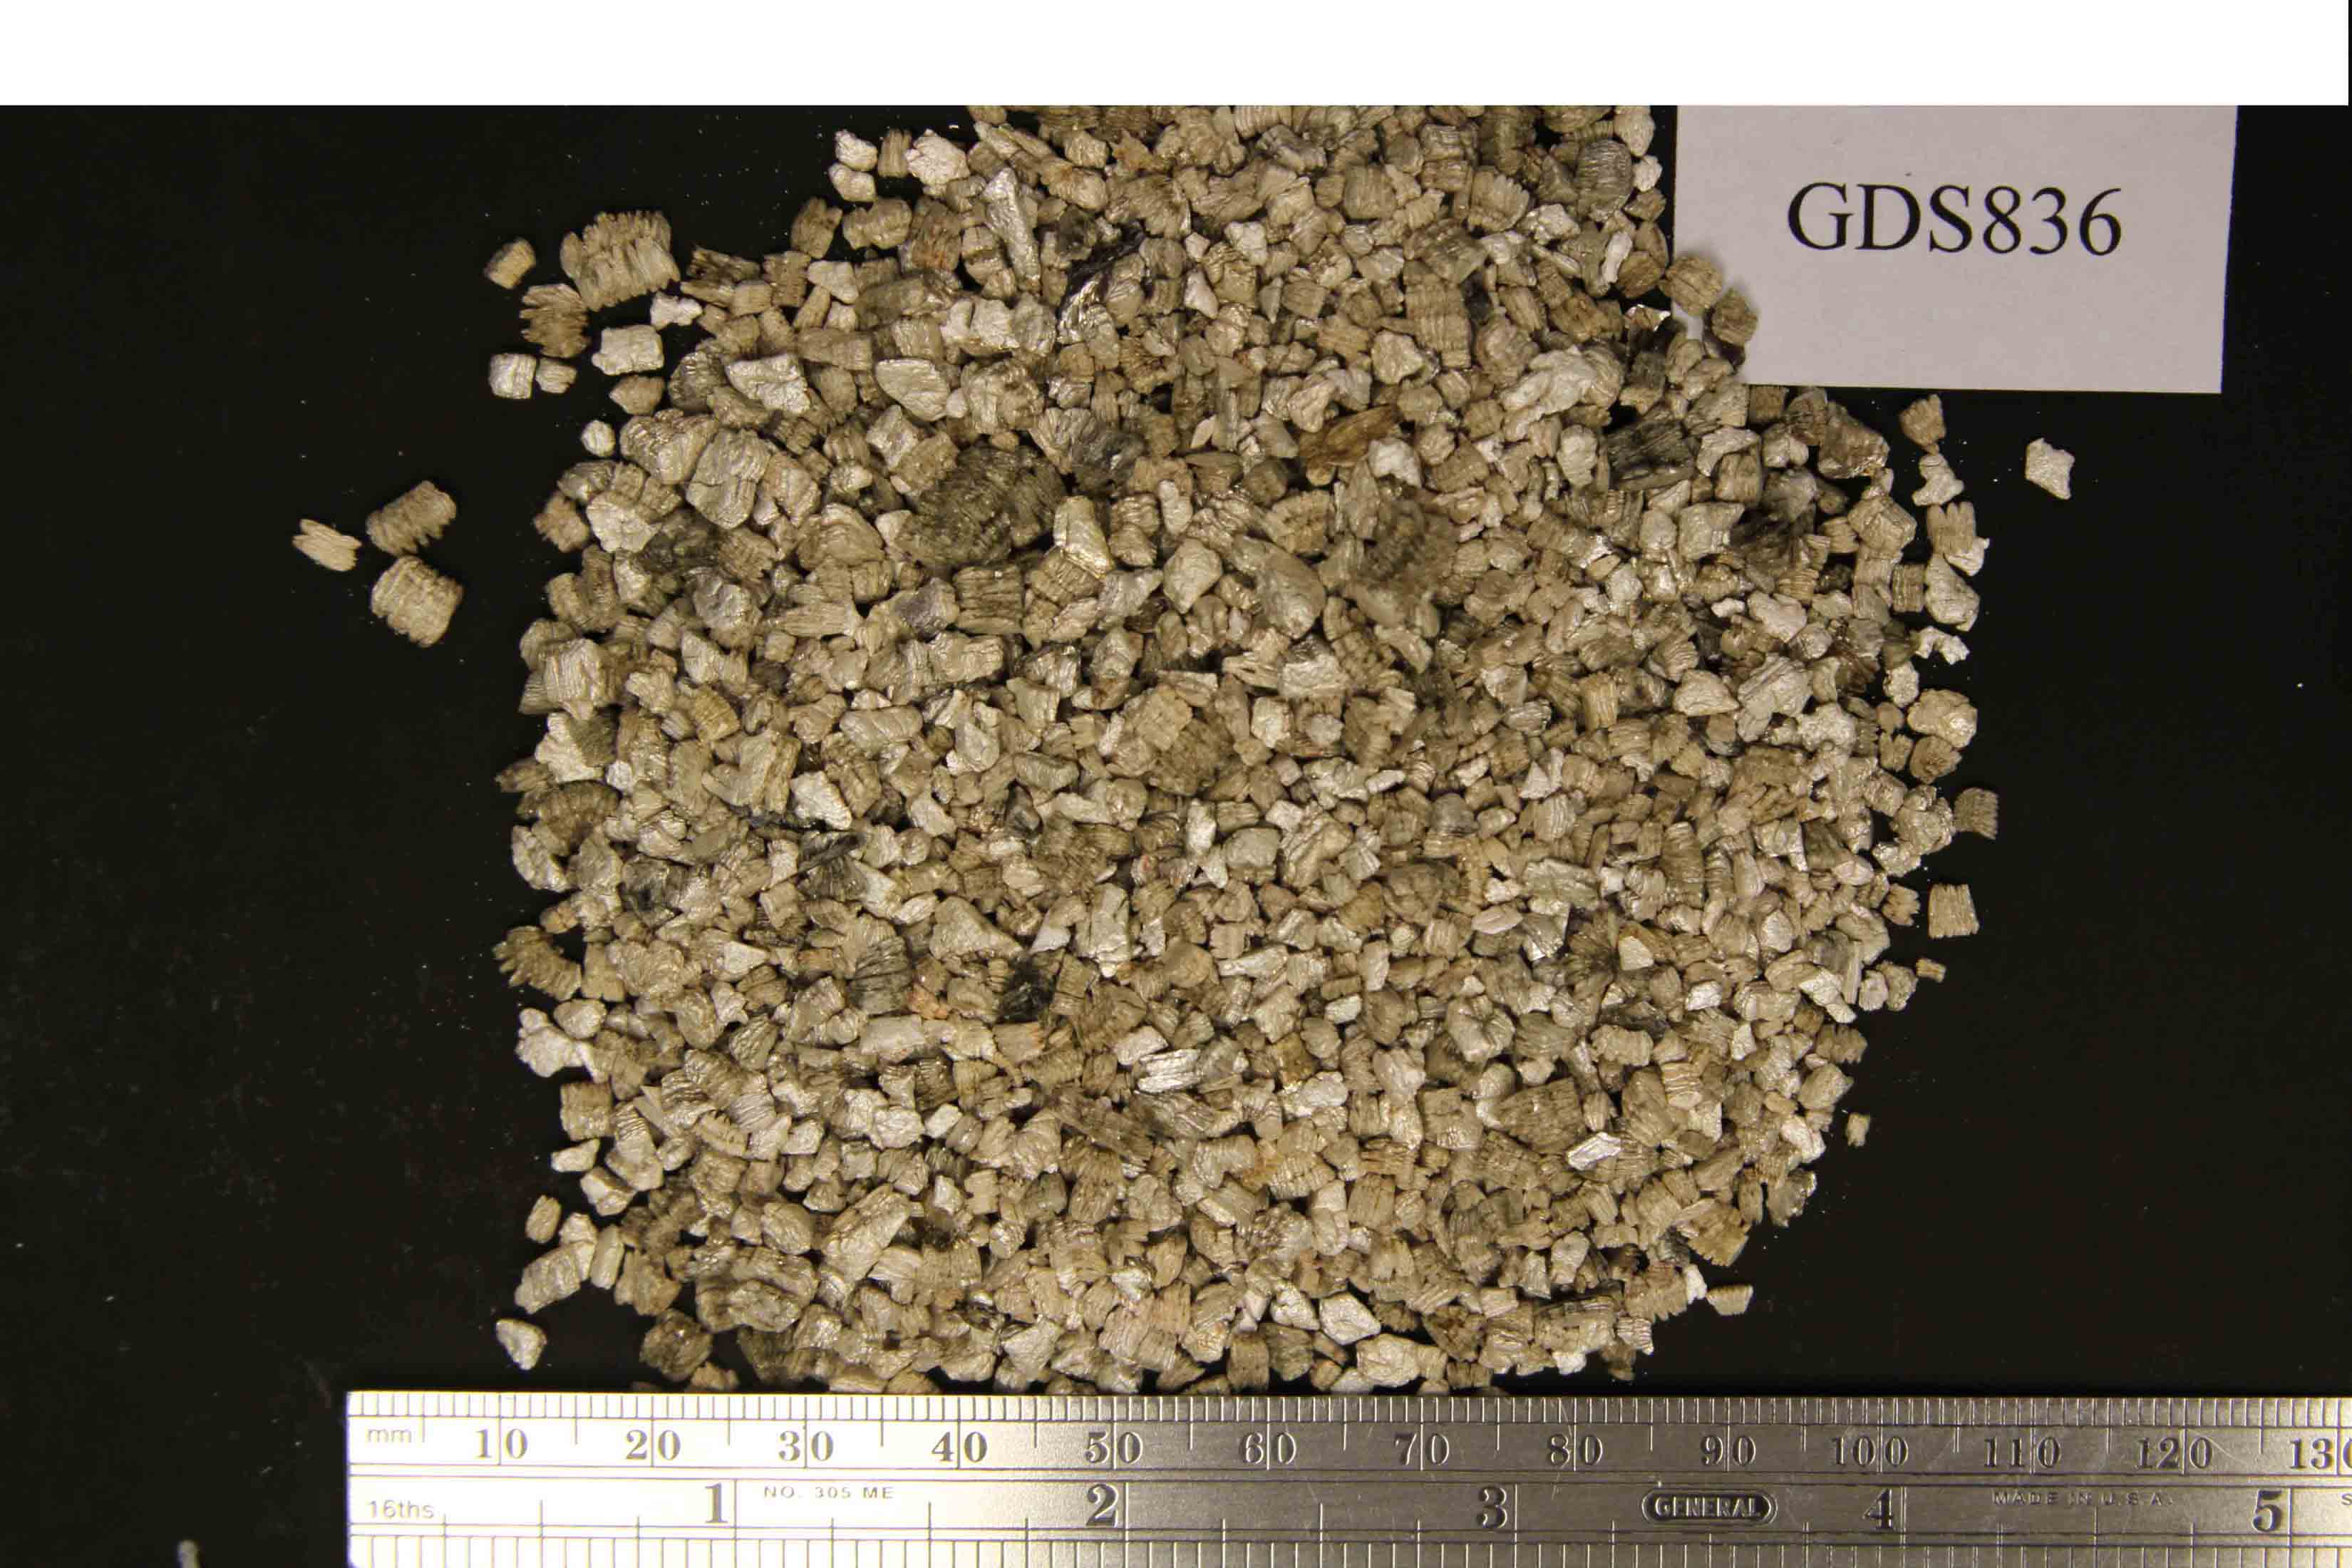
The sample has a mottled golden color with a few dark grains. Grains range in size from 2 10 mm (Fig. GDS836.photo.1).
A modified Cincinnati floation method was carried out on this sample. The sink fraction consists of mica flakes and small particles that were mounted on a stub for SEM examination.
The source of this expanded vermiculite is unknown, as it does not match the composition or spectrum of domestic vermiculites. It is from an unknown source.
Original spectrum published in:
IMAGE_OF_SAMPLE:
END_SAMPLE_DESCRIPTION.
XRD_ANALYSIS:
No XRD analysis is available for this sample.
END_XRD_ANALYSIS.
COMPOSITIONAL_ANALYSIS_TYPE: None # XRF, EPMA, ICP(Trace), WChem
COMPOSITION_TRACE: None
COMPOSITION_DISCUSSION:
The sample was examined with probe microanalysis. Spot analyses plot in a tight cluster centered near the upper left boarder of the Libby field on the Al/Ti versus Al/[Mg/(Mg+Fe)] diagram (Fig. GDS836.microprobe.1). About a third of the spot analyses plot outside of the Libby field with a few points plotting just inside the neighboring Palabora field (Fig. GDS836.microprobe.1).
END_COMPOSITION_DISCUSSION.
MICROSCOPIC_EXAMINATION:
The sample was examined with SEM and Energy dispersive spectroscopy. Particles from the sink fraction were placed on an SEM stub, which was coated with carbon, and examined under high magnification. Points analyzed with EDS are shown in color on SEM micrographs that accompany the EDS spectra. Numerous elongate compositionally <93>Libby-like<94> amphibole and tremolite particles were detected with EDS and SEM analyses (e.g., Figs. GDS836.EDS.1 and 2, and Fig. GDS836.SEM.1). The elongate amphibole particles in this sample are notably less elongate (i.e., they are byssolite like) than those in vermiculite samples from Libby, Montana (compare with Figs. at1UI.SEM.1, GDS332.SEM.2, GDS652.SEM.2, GDS653.SEM.1, and GDS701.SEM.2).
END_MICROSCOPIC_EXAMINATION.
SPECTROSCOPIC_DISCUSSION:
The spectrum is typical for a sample with predominately hydrobiotite and phlogopite/biotite. The 1.40/1.42 micron band depth ratio plots above the no detectable amphibole, talc, and serpentine line in Figures GDS836.spectrum.2 and 3. The reflectance spectrum of this sample does not have a detectable 2.24-micron band so there is no symbol on Fig. GDS836.spectrum.4. The spectral parameters plot in the Mixtures field (Figs. GDS836.spectrum.2 and 3).
SPECTRAL_PURITY: 1b2_3_4_ # 1= 0.2-3, 2= 1.5-6, 3= 6-25, 4= 20-150 microns