
|
DOCUMENTATION_FORMAT: Man_Made
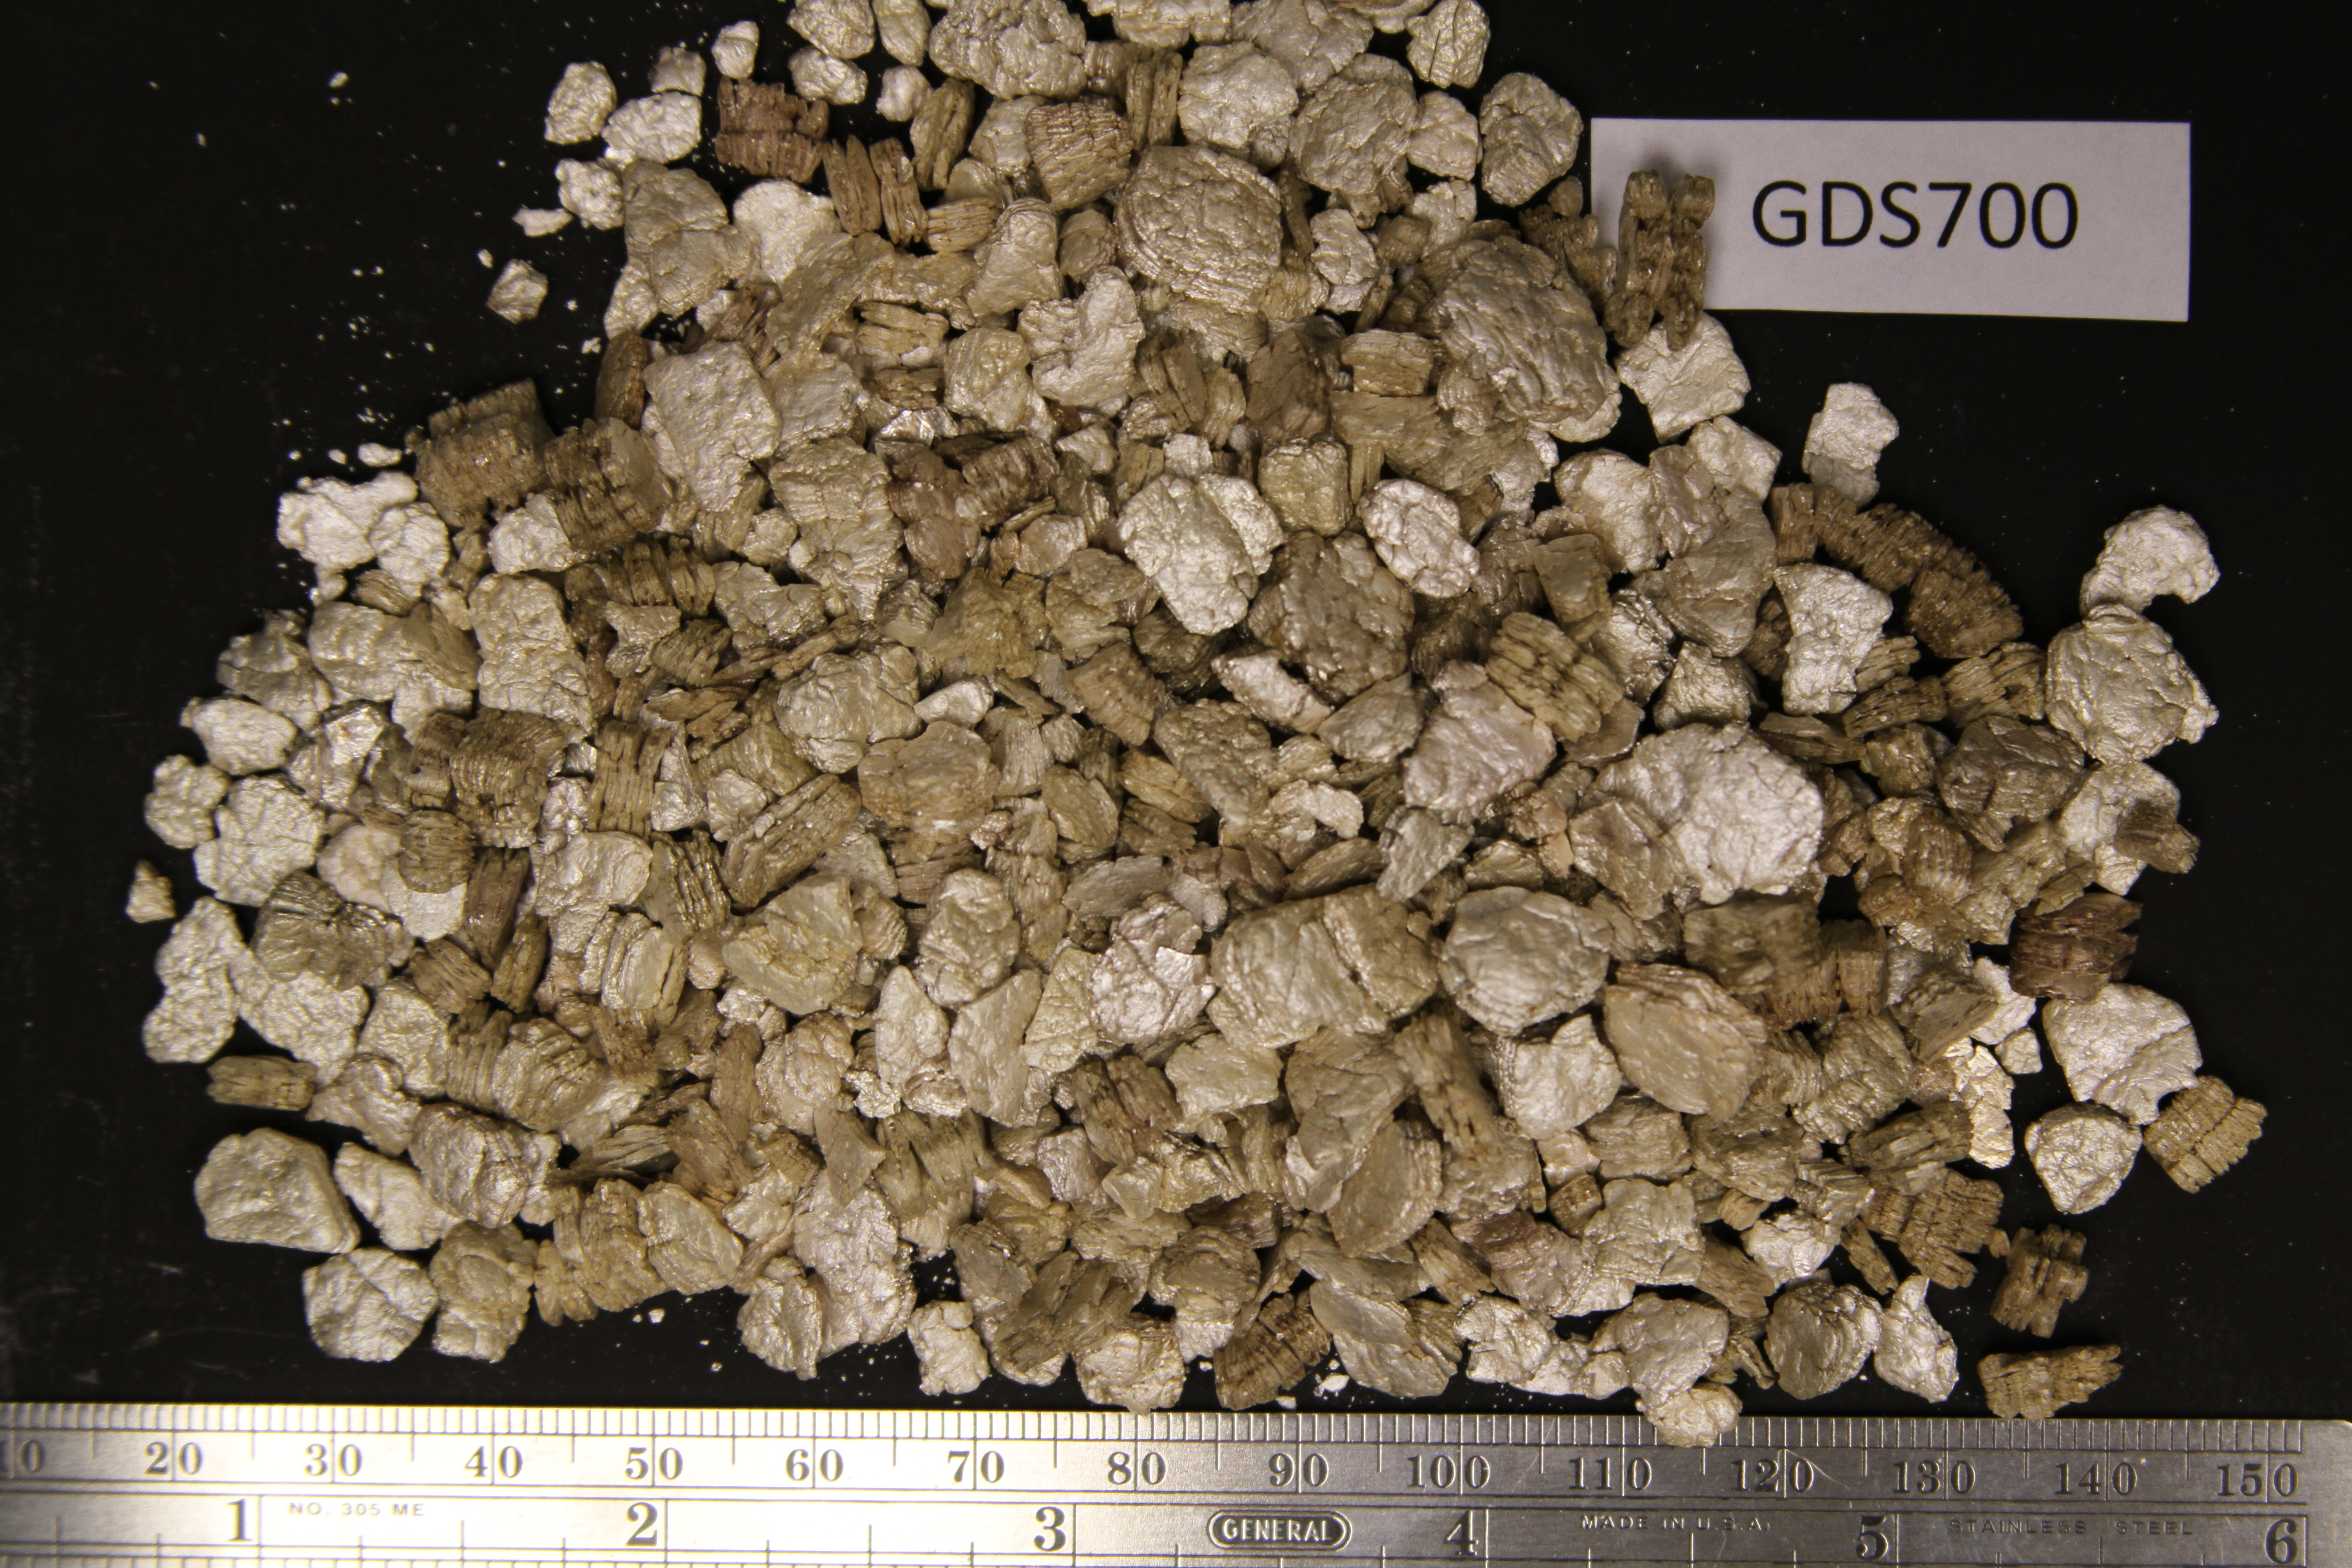
SAMPLE_ID: GDS700
MATERIAL_TYPE: Expanded Phyllosilicates
MATERIAL: Expanded Vermiculite Ore
FORMULA: (Mg,Fe2+,Al)3(Si,Al)4O10(OH)2.4H2O
FORMULA_HTML: (Mg,Fe2+,Al)3(Si,Al)4O10(OH)2.4H2O
COLLECTION_LOCALITY: This sample came from a bag of Sun Gro ® vermiculite chemical packing found at the U.S. Geological Survey in Denver, Colorado.
ORIGINAL_DONOR:
CURRENT_SAMPLE_LOCATION: USGS Denver, CO
ULTIMATE_SAMPLE_LOCATION: USGS Denver, CO
SAMPLE_DESCRIPTION:
The sample has a mottled golden color and ranges in grain size from 1 – 12 mm with an average around 8 mm (Fig. GDS700.photo.1). Grains are relatively free from dust.
A modified Cincinnati floation method was carried out on this sample. The sink fraction consists of mica flakes and small particles that were mounted on a stub for SEM examination.
The sample has a spectral signature similar to that of expanded vermiculite ore from the Palabora Mine, Phalaborwa, South Africa.
Original spectrum published in:
IMAGE_OF_SAMPLE:
END_SAMPLE_DESCRIPTION.
XRD_ANALYSIS:
Rietveld refinement XRD analysis (limited quantities of sample and no internal standard) of the Cincinnati Method sink fraction indicates the presence of major diopside and muscovite, minor calcite, quartz, tridymite, and trace apatite (Fig. GDS700.XRD.2). The bulk sample XRD analysis (Fig. GDS700.XRD.3) indicates hyrobiotite, vermiculite, biotite, and phlogopite.
END_XRD_ANALYSIS.
COMPOSITIONAL_ANALYSIS_TYPE: None # XRF, EPMA, ICP(Trace), WChem
COMPOSITION_TRACE: None
COMPOSITION_DISCUSSION:
The sample was examined with probe microanalysis. Spot analyses plot in the Palabora field on the Al/Ti versus Al/[Mg/(Mg+Fe)] diagram (Fig. GDS700.microprobe.1).
END_COMPOSITION_DISCUSSION.
MICROSCOPIC_EXAMINATION:
The sample was examined with SEM and Energy dispersive spectroscopy. Particles from the sink fraction were placed on an SEM stub, which was coated with carbon, and examined under high magnification. A quartz grain was found (Figs. GDS700.EDS.17 and 18, and GDS700.SEM.7), in addition to numerous biotite and hydrobiotite grains. No talc or amphibole grains were found.
END_MICROSCOPIC_EXAMINATION.
SPECTROSCOPIC_DISCUSSION:
The spectrum is typical for a sample with predominately hydrobiotite and phlogopite/biotite. The 1.40/1.42 micron band depth ratio plots just above the “no detectable amphibole, talc, and serpentine” line in Figures GDS700.spectrum.2 and 3. This reflectance spectrum of this sample does not have a detectable 2.24-micron band so there is no symbol on Fig. GDS700.spectrum.4. The spectral parameters plot in the Palabora field (Figs. GDS700.spectrum.2 to 3).
SPECTRAL_PURITY: 1b2_3_4_ # 1= 0.2-3, 2= 1.5-6, 3= 6-25, 4= 20-150 microns