
|
DOCUMENTATION_FORMAT: Man_Made
SAMPLE_ID: GDS663
MATERIAL_TYPE: Expanded Phyllosilicates
MATERIAL: Expanded Vermiculite Ore
FORMULA: (Mg,Fe2+,Al)3(Si,Al)4O10(OH)2.4H2O
FORMULA_HTML: (Mg,Fe2+,Al)3(Si,Al)4O10(OH)2.4H2O
COLLECTION_LOCALITY: This sample was collected from a box used to send chemical reagents to the U.S. Geological Survey in Denver, Colorado in 2004.
ORIGINAL_DONOR:
CURRENT_SAMPLE_LOCATION: USGS Denver, CO
ULTIMATE_SAMPLE_LOCATION: USGS Denver, CO
SAMPLE_DESCRIPTION:
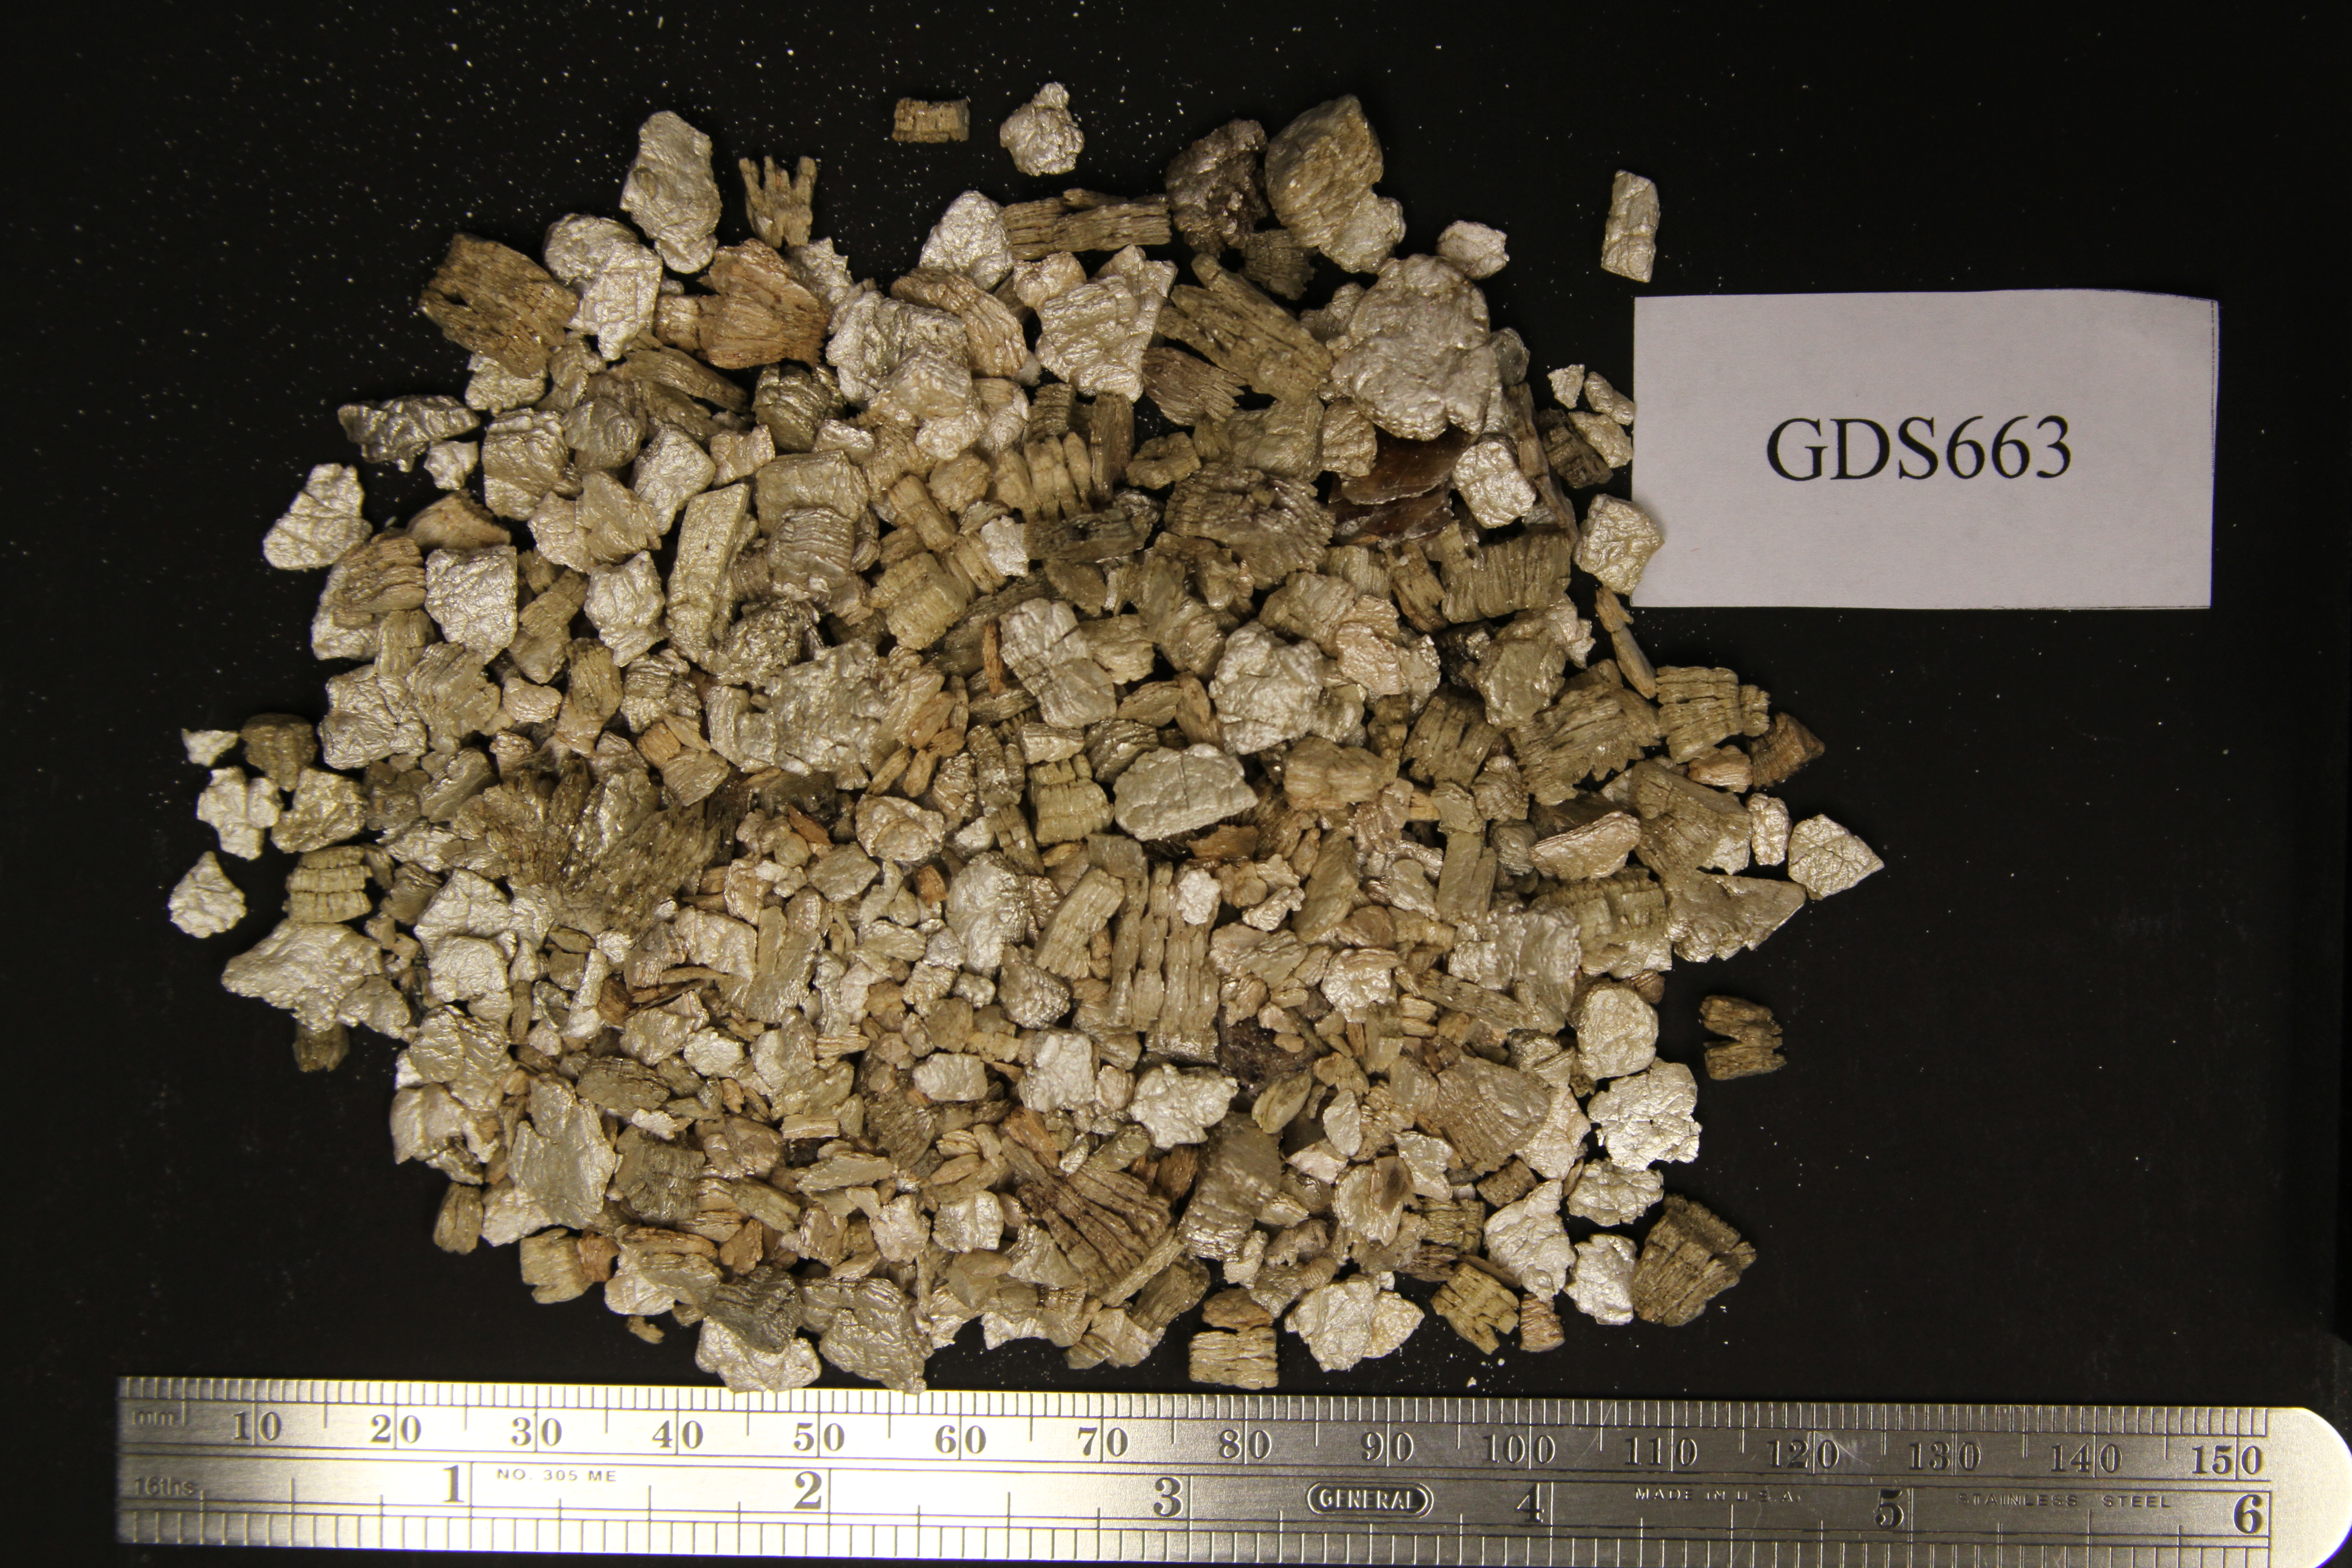
The sample has a mottled golden color and ranges in grain size from 3 - 14 mm (Fig. GDS663.photo.1). Grains are relatively free from dust.
A modified Cincinnati floation method was carried out on this sample. The sink fraction consists of mica flakes and small particles that were mounted on a stub for SEM examination. The sink fraction consists of mica flakes and small particles that were mounted on a stub for SEM examination.
The sample has a spectral signature similar to that of expanded vermiculite ore from the Palabora Mine, Phalaborwa, South Africa.
Original spectrum published in:
IMAGE_OF_SAMPLE:
END_SAMPLE_DESCRIPTION.
XRD_ANALYSIS:
Rietveld refinement XRD analysis (limited quantities of sample and no internal standard) of the Cincinnati Method sink fraction indicates the presence of major diopside, minor calcite, and trace levels of phlogopite and apatite (Fig. GDS663.XRD.2).
END_XRD_ANALYSIS.
COMPOSITIONAL_ANALYSIS_TYPE: None # XRF, EPMA, ICP(Trace), WChem
COMPOSITION_TRACE: None
COMPOSITION_DISCUSSION:
The sample was examined with probe microanalysis. Spot analyses plot in the Palabora field on the Al/Ti versus Al/[Mg/(Mg+Fe)] diagram (Fig. GDS663.microprobe.1).
END_COMPOSITION_DISCUSSION.
MICROSCOPIC_EXAMINATION:
The sample was examined with SEM and Energy dispersive spectroscopy. Particles from the sink fraction were placed on an SEM stub, which was coated with carbon, and examined under high magnification. Points analyzed with EDS are shown in color on SEM micrographs that accompany the EDS spectra. A single relatively small elongate amphibole grain was found (Figs. GDS663.EDS.1 and 2 and GDS663.SEM.1 and 2). This is probably contamination from Libby or Enoree samples likely introduced by air transport during processing for the Cincinnati Method. No large amphibole bundles characteristic of the Libby samples were found in this sample. Diopside, titanite, and fiberglass grains were also found.
END_MICROSCOPIC_EXAMINATION.
SPECTROSCOPIC_DISCUSSION:
The spectrum is typical for a sample with predominately hydrobiotite and phlogopite/biotite. The 1.40/1.42 micron band depth ratio plots above the “no detectable amphibole, talc, and serpentine” line in Figures GDS663.spectrum.2 and 3. The reflectance spectrum of this sample does have a detectable 2.24-micron band so its spectral parameter symbol does plot in the Palabora/mixtures field on Fig. GDS663.spectrum.4. The spectral parameters plot in the Palabora field (Figs. GDS663.spectrum.2 and 3).
SPECTRAL_PURITY: 1b2_3_4_ # 1= 0.2-3, 2= 1.5-6, 3= 6-25, 4= 20-150 microns