
|
DOCUMENTATION_FORMAT: Man_Made
SAMPLE_ID: GDS652
MATERIAL_TYPE: Expanded Phyllosilicates
MATERIAL: Expanded Vermiculite Ore
FORMULA: (Mg,Fe2+,Al)3(Si,Al)4O10(OH)2.4H2O
FORMULA_HTML: (Mg,Fe2+,Al)3(Si,Al)4O10(OH)2.4H2O
COLLECTION_LOCALITY:
ORIGINAL_DONOR: This sample was supplied by the U.S. EPA in 2005 and was labeled “Zonolite ® Chemical Packing.”
CURRENT_SAMPLE_LOCATION: USGS Denver, CO
ULTIMATE_SAMPLE_LOCATION: USGS Denver, CO
SAMPLE_DESCRIPTION:
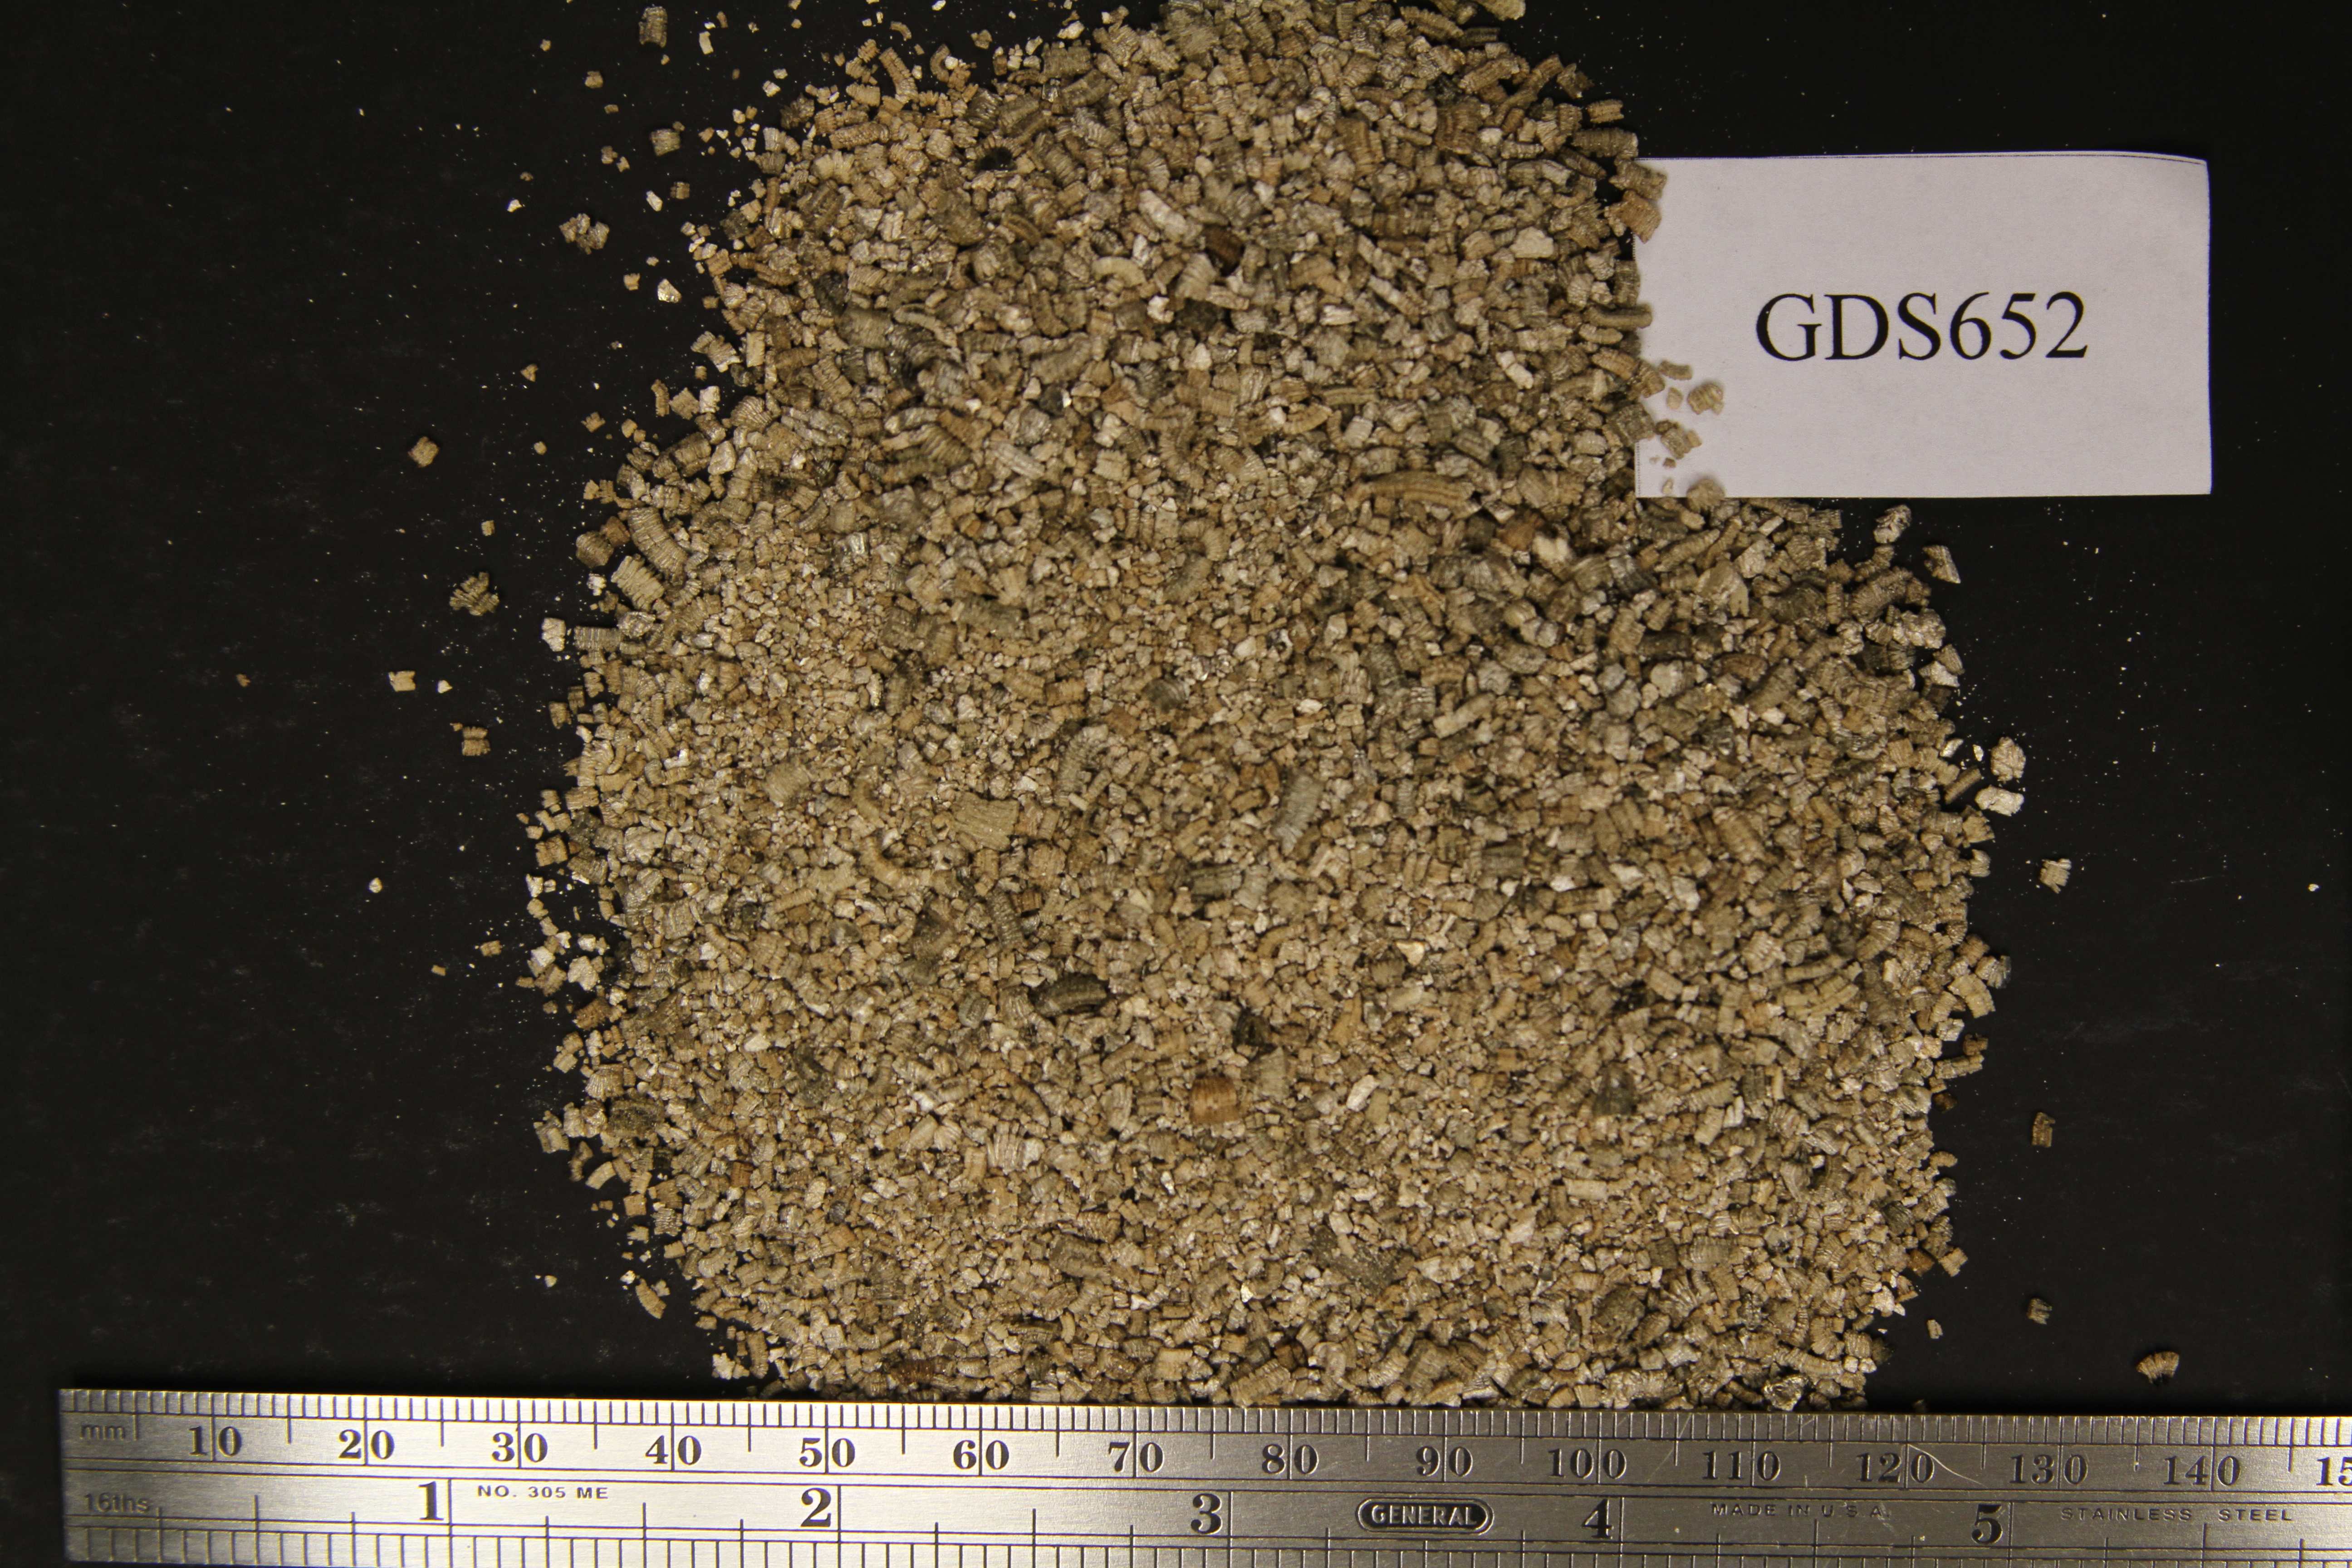
The sample has a mottled golden color with occasional dark grains and grains range in size from 0.5 - 7 mm (Fig. GDS652.photo.1).
A modified Cincinnati floation method was carried out on this sample. The sink fraction consists of mica flakes and small elongate amphibole bundles, the later of which were mounted on a stub for SEM examination.
The sample has a spectral signature similar to that of expanded vermiculite ore from Libby, Montana, USA.
Original spectrum published in:
IMAGE_OF_SAMPLE:
END_SAMPLE_DESCRIPTION.
XRD_ANALYSIS:
No XRD analysis is available for this sample.
END_XRD_ANALYSIS.
COMPOSITIONAL_ANALYSIS_TYPE: None # XRF, EPMA, ICP(Trace), WChem
COMPOSITION_TRACE: None
COMPOSITION_DISCUSSION:
The sample was examined with probe microanalysis. Spot analyses plot in the Libby field on the Al/Ti versus Al/[Mg/(Mg+Fe)] diagram (Fig. GDS652.microprobe.1).
END_COMPOSITION_DISCUSSION.
MICROSCOPIC_EXAMINATION:
The sample was examined with SEM and Energy dispersive spectroscopy. Elongate amphibole bundles were placed on stubs, coated with carbon, and examined under high magnification. Points analyzed with EDS are shown in color on SEM micrographs that accompany the EDS spectra. Bundles consist of individual elongate mineral particles (Fig. GDS652.SEM.1 and 2) and the EDS-derived composition is consistent with Libby amphibole (Figs. GDS652.EDS.1 and 2).
END_MICROSCOPIC_EXAMINATION.
SPECTROSCOPIC_DISCUSSION:
Average spectrum typical for a sample with predominately vermiculite with minor hydrobiotite and a trace biotite. The 1.40/1.42 micron band depth ratio indicates the presence of amphibole, talc, or serpentine probably at the few weight percent level. The shapes of the grains of these contaminants cannot be discerned by spectroscopy. The spectral parameters plot in the Libby, MT fields (Figs. GDS652.spectrum.2 to 4).
SPECTRAL_PURITY: 1b2_3_4_ # 1= 0.2-3, 2= 1.5-6, 3= 6-25, 4= 20-150 microns