
|
DOCUMENTATION_FORMAT: Man_Made
SAMPLE_ID: GDS650
MATERIAL_TYPE: Expanded Phyllosilicates
MATERIAL: Expanded Vermiculite Ore
FORMULA: (Mg,Fe2+,Al)3(Si,Al)4O10(OH)2.4H2O
FORMULA_HTML: (Mg,Fe2+,Al)3(Si,Al)4O10(OH)2.4H2O
COLLECTION_LOCALITY: This sample was supplied by the U.S. EPA in 2005 and was labeled ōTherm-O-Rock «.ö
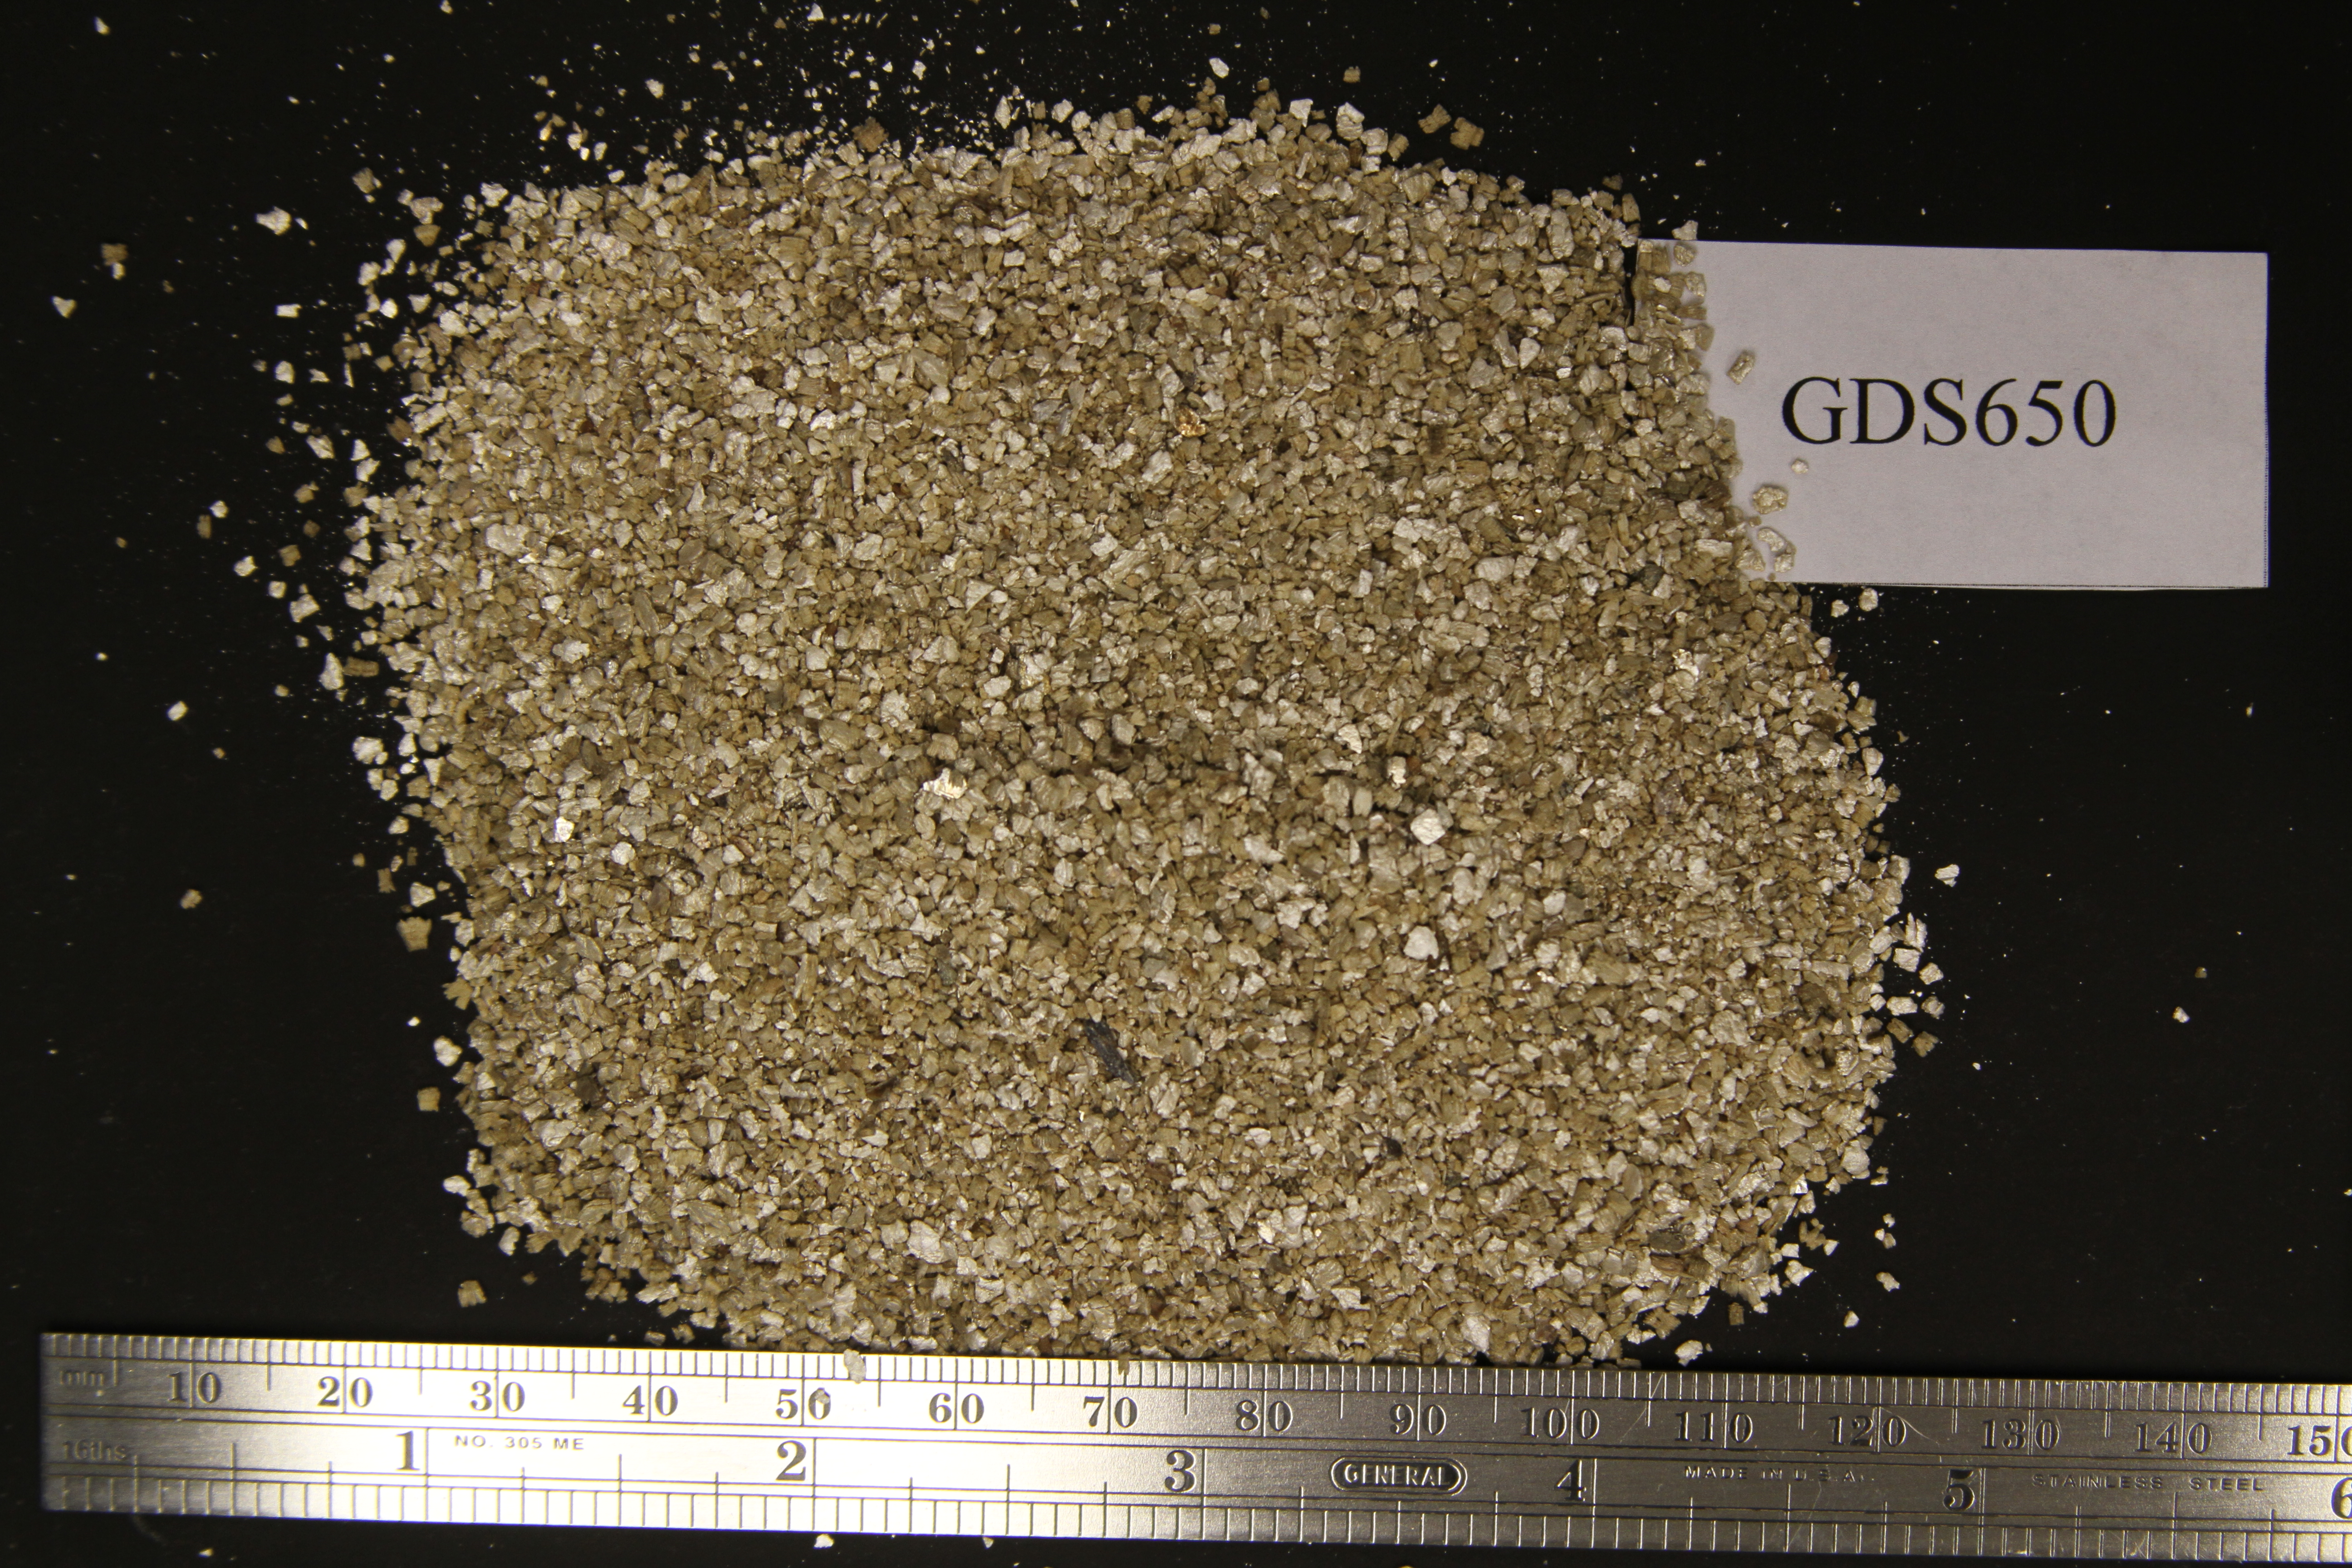
ORIGINAL_DONOR: The vermiculite has a mottled golden color with a few dark grains. Grains range in size from 0.5 - 2 mm with occasional 4 mm grains (Fig. GDS650.photo.1).
CURRENT_SAMPLE_LOCATION: USGS Denver, CO
ULTIMATE_SAMPLE_LOCATION: USGS Denver, CO
SAMPLE_DESCRIPTION:
The sample has a mottled golden color with a few dark grains. Grains range in size from 0.5 - 2 mm with occasional 4 mm grains (Fig. GDS650.photo.1).
A modified Cincinnati floation method was carried out on this sample. The sink fraction consists of mica flakes and small elongate amphibole bundles, the later of which were mounted on a stub for SEM examination.
The sample has a spectral signature similar to that of a mixture of vermiculite ore from the Palabora Mine, in Phalaborwa, South Africa and from Enoree, South Carolina. Januch and McDermott (2000) indicate that this sample of <93>Therm-O-Rock «<94> is a mixture of vermiculite ore from Enoree, South Carolina and from a mine in South Africa.
Original spectrum published in: This sample was supplied by the U.S. EPA in 2005 and was labeled ōTherm-O-Rock «.ö Januch, J. and McDermott, K., 2000, Sampling and analysis of consumer garden products that contain vermiculite: Region 10, Office of Environmental Assessment, U.S. Environmental Protection Agency Report No. EPA 744-R-00-010, 205p.
IMAGE_OF_SAMPLE:
END_SAMPLE_DESCRIPTION.
XRD_ANALYSIS:
Rietveld refinement XRD analysis (limited quantities of sample and no internal standard) of the Cincinnati Method sink fraction indicates major diopside, minor calcite, phlogopite, tridymite, apatite, and trace quartz (Fig. GDS650.XRD.2).
END_XRD_ANALYSIS.
COMPOSITIONAL_ANALYSIS_TYPE: None # XRF, EPMA, ICP(Trace), WChem
COMPOSITION_TRACE: None
COMPOSITION_DISCUSSION:
The sample was examined with probe microanalysis. Spot analyses plot in the Palabora and Enoree fields on the Al/Ti versus Al/[Mg/(Mg+Fe)] diagram (Fig. GDS650.microprobe.1). Five spot analyses plot above the Palabora field and left of the top Enoree field.
END_COMPOSITION_DISCUSSION.
MICROSCOPIC_EXAMINATION:
The sample was examined with SEM and Energy dispersive spectroscopy. Particles from the sink fraction were placed on an SEM stub, which was coated with carbon, and examined under high magnification. Points analyzed with EDS are shown in color on SEM micrographs that accompany the EDS spectra. One elongate amphibole particle was detected with EDS and SEM analyses (Figs. GDS650.EDS.12 and 13 and Fig. GDS650.SEM.4).
END_MICROSCOPIC_EXAMINATION.
SPECTROSCOPIC_DISCUSSION:
The spectrum is typical for a sample with predominately hydrobiotite and phlogopite/biotite. The 1.40/1.42 micron band depth ratio plots slightly below the ōno detectable amphibole, talc, and serpentineö line in Figures GDS650.spectrum.2 and 3. The reflectance spectrum of this sample does not have a detectable 2.24-micron band so there is no symbol on Fig. GDS650.spectrum.4. The spectral parameters plot in the Mixtures field (Figs. GDS650.spectrum.2 and 3) indicating the presence of vermiculite from two sources.
SPECTRAL_PURITY: 1b2_3_4_ # 1= 0.2-3, 2= 1.5-6, 3= 6-25, 4= 20-150 microns