
|
DOCUMENTATION_FORMAT: Man_Made
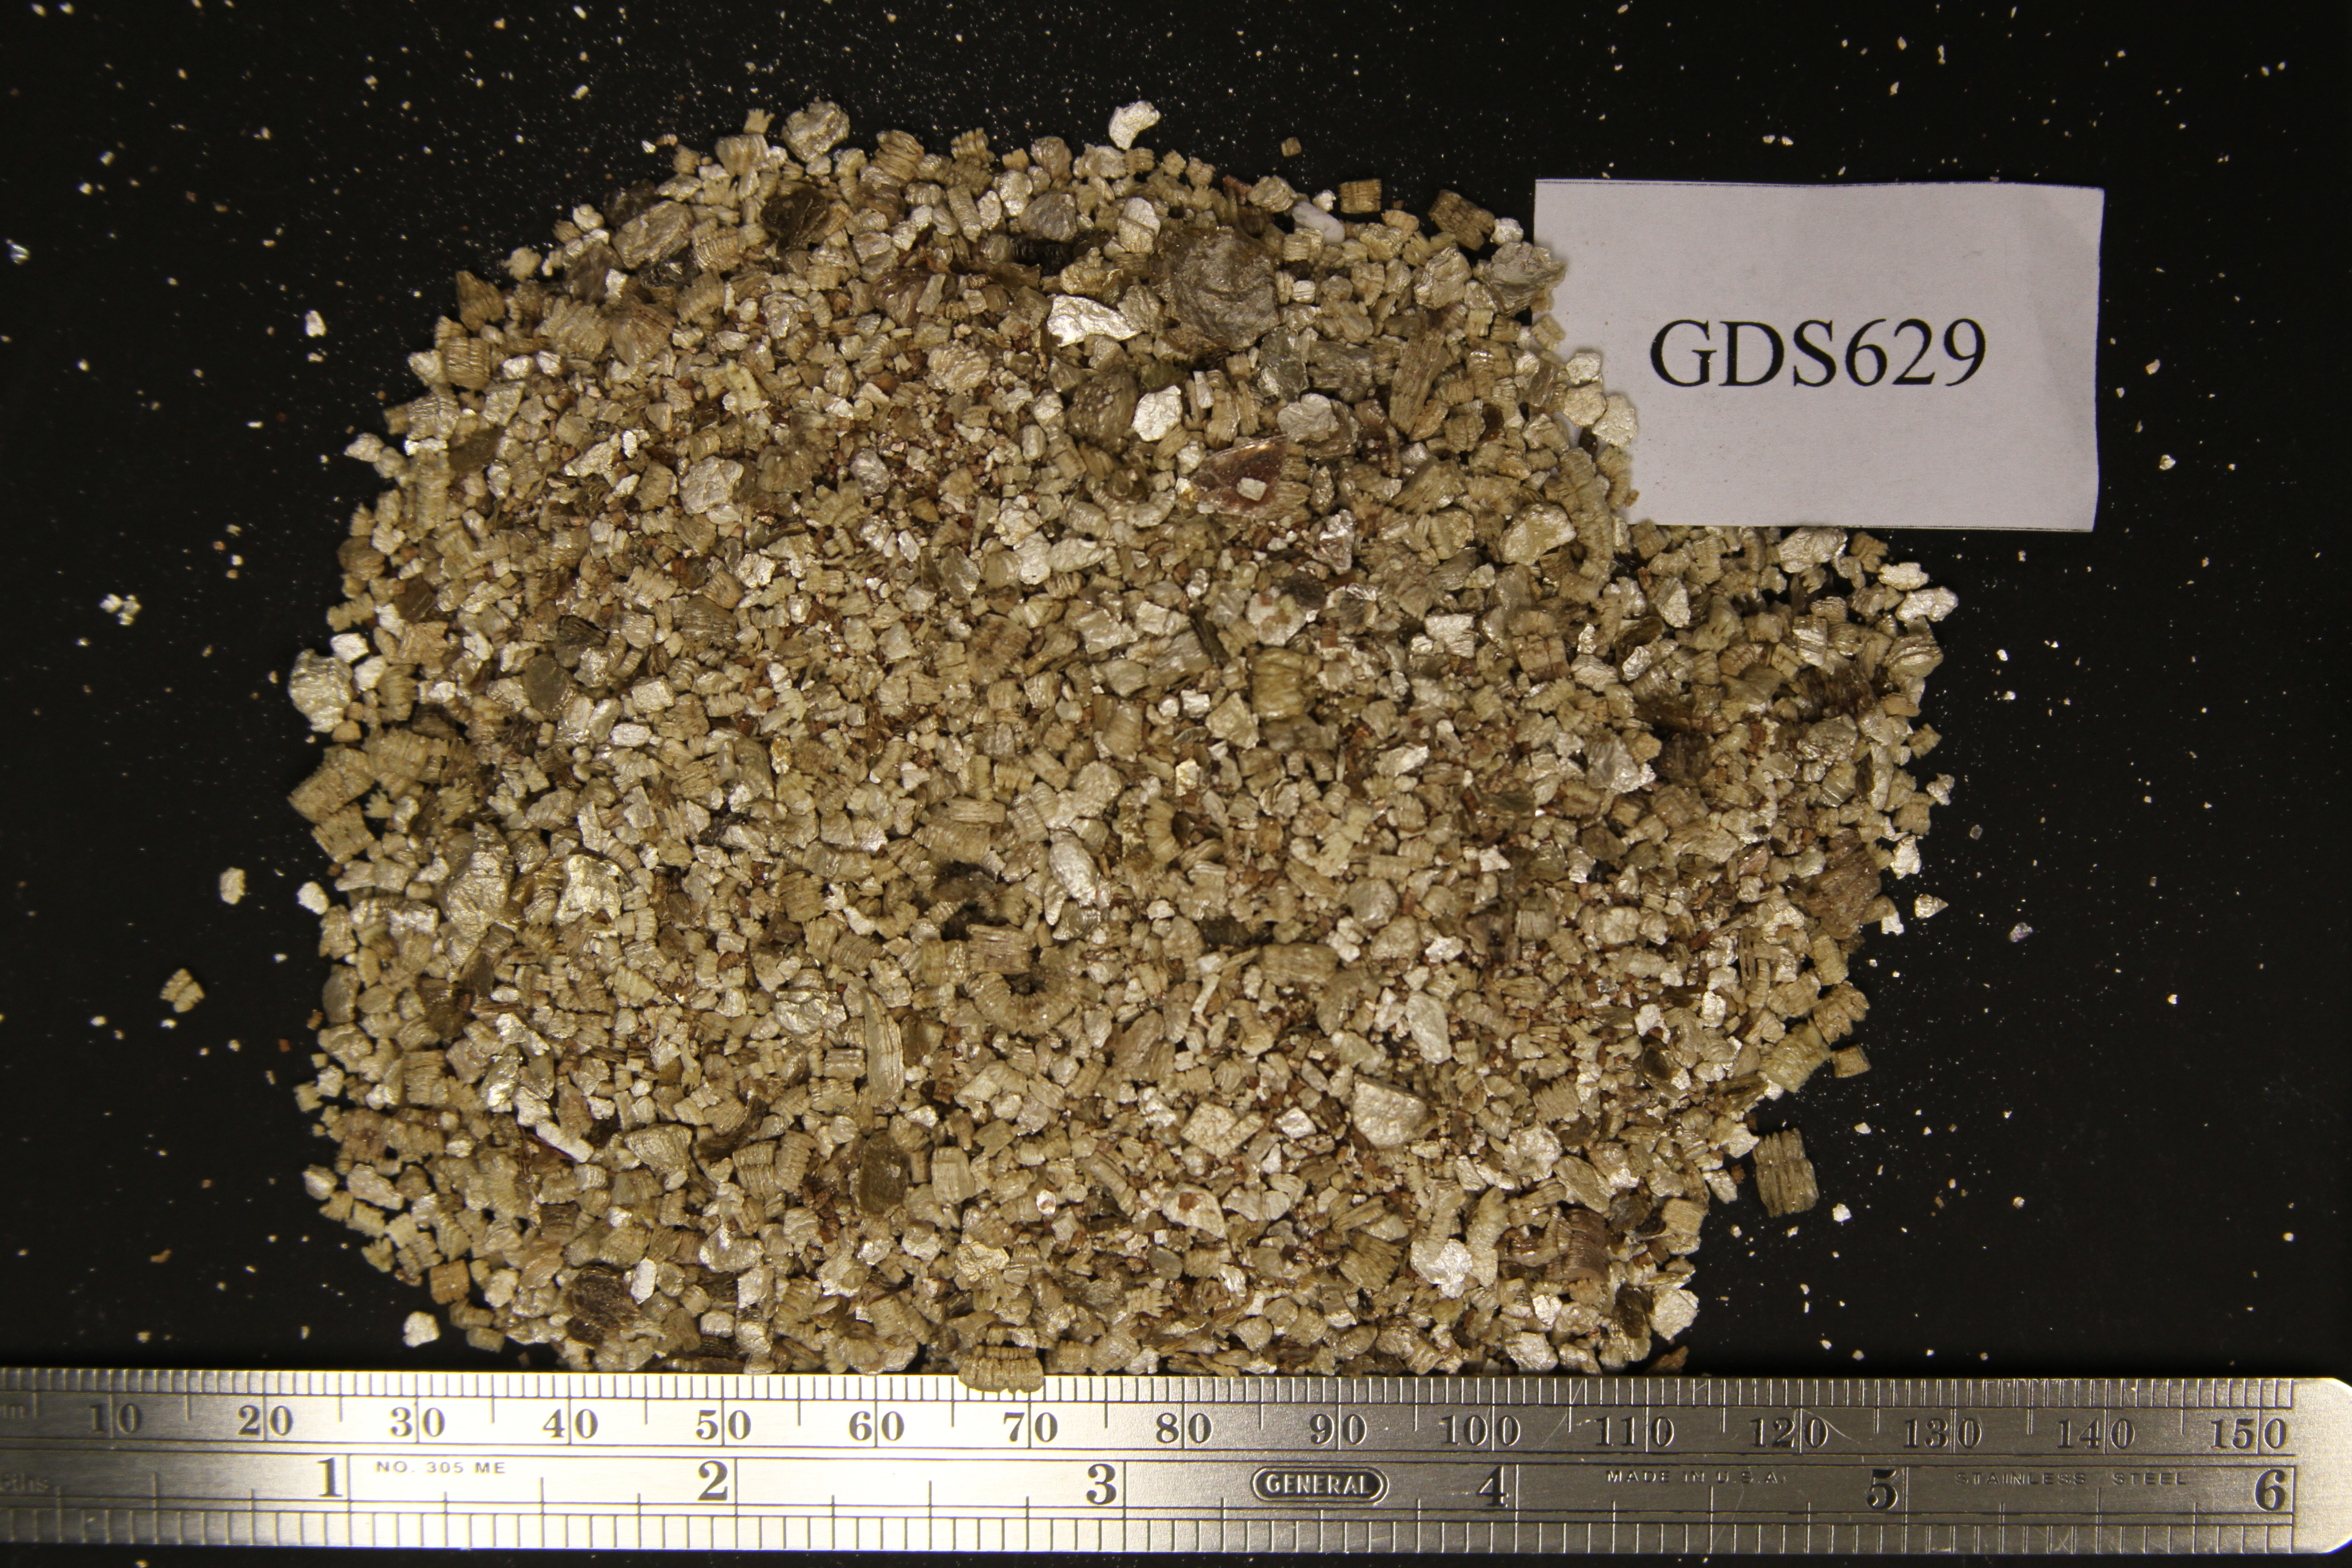
SAMPLE_ID: GDS629
MATERIAL_TYPE: Expanded Phyllosilicates
MATERIAL: Expanded Vermiculite Ore
FORMULA: (Mg,Fe2+,Al)3(Si,Al)4O10(OH)2.4H2O
FORMULA_HTML: (Mg,Fe2+,Al)3(Si,Al)4O10(OH)2.4H2O
COLLECTION_LOCALITY: This sample was collected from a box used to send chemical reagents to the U.S. Geological Survey in Denver, Colorado in 2001.
ORIGINAL_DONOR:
CURRENT_SAMPLE_LOCATION: USGS Denver, CO
ULTIMATE_SAMPLE_LOCATION: USGS Denver, CO
SAMPLE_DESCRIPTION:
The sample has a mottled golden color with frequent dark grains and grain size 0.5 to 6 mm (Fig. GDS629.photo.1).
A modified Cincinnati floation method was carried out on this sample. The sink fraction consists of mica flakes and small particles that were mounted on a stub for SEM examination.
The sample has a spectral signature similar to a mixture of vermiculites ores from Palabora, S. Africa and Enoree, South Carolina, USA.
Original spectrum published in:
IMAGE_OF_SAMPLE:
END_SAMPLE_DESCRIPTION.
XRD_ANALYSIS:
Rietveld refinement XRD analysis (limited quantities of sample and no internal standard) of the Cincinnati Method sink fraction indicates the presence of major quartz, augite, minor dolomite and tridymite with trace chrysotile and vermiculite (Fig. GDS629.XRD.2). Augite and diopside are common constituents of Palabora ore. Qualitative XRD analysis of the bulk sample indicates the presence of biotite, phlogopite, hydrobiotite, vermiculite, talc, and amphibole (Fig. GDS629.XRD.3).
END_XRD_ANALYSIS.
COMPOSITIONAL_ANALYSIS_TYPE: None # XRF, EPMA, ICP(Trace), WChem
COMPOSITION_TRACE: None
COMPOSITION_DISCUSSION:
The sample was examined with probe microanalysis. Spot analyses plot mostly in the Palabora field on the Al/Ti versus Al/[Mg/(Mg+Fe)] diagram (Fig. GDS629.microprobe.1). Two spot analyses plot in the right Enoree/Louisa fields, while three spot analyses plot above the Palabora field close to the uppermost Enoree field. These compositions suggest the sample is a mixture of ores mainly from Palabora with a minor amount from Enoree. No spot analyses plot in the Libby field outside of the area overlapped by the Enoree/Louisa fields.
END_COMPOSITION_DISCUSSION.
MICROSCOPIC_EXAMINATION:
The sample was examined with SEM and Energy dispersive spectroscopy. Particles from the sink fraction were placed on an SEM stub, which was coated with carbon, and examined under high magnification. Points analyzed with EDS are shown in color on SEM micrographs that accompany the EDS spectra. Elongate amphibole particles were detected based on EDS and SEM analyses (Figs. GDS629.EDS.1 and 2, and GDS629.SEM.1; GDS629.EDS.3 to 6 and and GDS627.SEM.2). Talc or anthophyllite grains were also identified (e.g., Figs. GDS629.EDS.13 and 14, and GDS629.SEM.5; GDS629.EDS.15 to 17, and GDS629.SEM.6). Vermiculite other than that from Libby, Montana can contain amphibole with composition <93>consistent<94> with <93>Libby amphibole.<94> The amphibole bundle (Fig. GDS629.SEM.1) and other elongate amphibole particles may be associated with the Enoree component in this sample and are similar in appearance to those present in sample GDS627 (e.g., Fig. GDS627.SEM.8). No chrysotile was found in the sink fraction by EDS and SEM analyses.
END_MICROSCOPIC_EXAMINATION.
SPECTROSCOPIC_DISCUSSION:
The spectrum is typical for a sample with predominately hydrobiotite and phlogopite/biotite. The 1.40/1.42 micron band depth ratio indicates the presence of amphibole, talc, or serpentine probably at the few weight percent level. The shape of these contaminants cannot be discerned by spectroscopy. The spectral parameters plot in the Libby field (Figs. GDS629.spectrum.2 and 3). However, Figure GDS629.spectrum.4 shows that the wavelength position of this sample’s 2.24-micron band plots at a longer wavelength (above the Libby field) compatible with those in Enoree and Louisa samples. The rare combination of ores from Palabora and Enoree in these proportions mimics the spectral signature of Libby ore in some respects but fails the “Libby false positive elimination test.”
SPECTRAL_PURITY: 1b2_3_4_ # 1= 0.2-3, 2= 1.5-6, 3= 6-25, 4= 20-150 microns