
|
DOCUMENTATION_FORMAT: Man_Made
SAMPLE_ID: GDS628
MATERIAL_TYPE: Expanded Phyllosilicates
MATERIAL: Expanded Vermiculite Ore
FORMULA: (Mg,Fe2+,Al)3(Si,Al)4O10(OH)2.4H2O
FORMULA_HTML: (Mg,Fe2+,Al)3(Si,Al)4O10(OH)2.4H2O
COLLECTION_LOCALITY: This sample came from a bag of ACE HardwareÛ horticultural vermiculite purchased locally in Denver in 2001.
ORIGINAL_DONOR:
CURRENT_SAMPLE_LOCATION: USGS Denver, CO
ULTIMATE_SAMPLE_LOCATION: USGS Denver, CO
SAMPLE_DESCRIPTION:
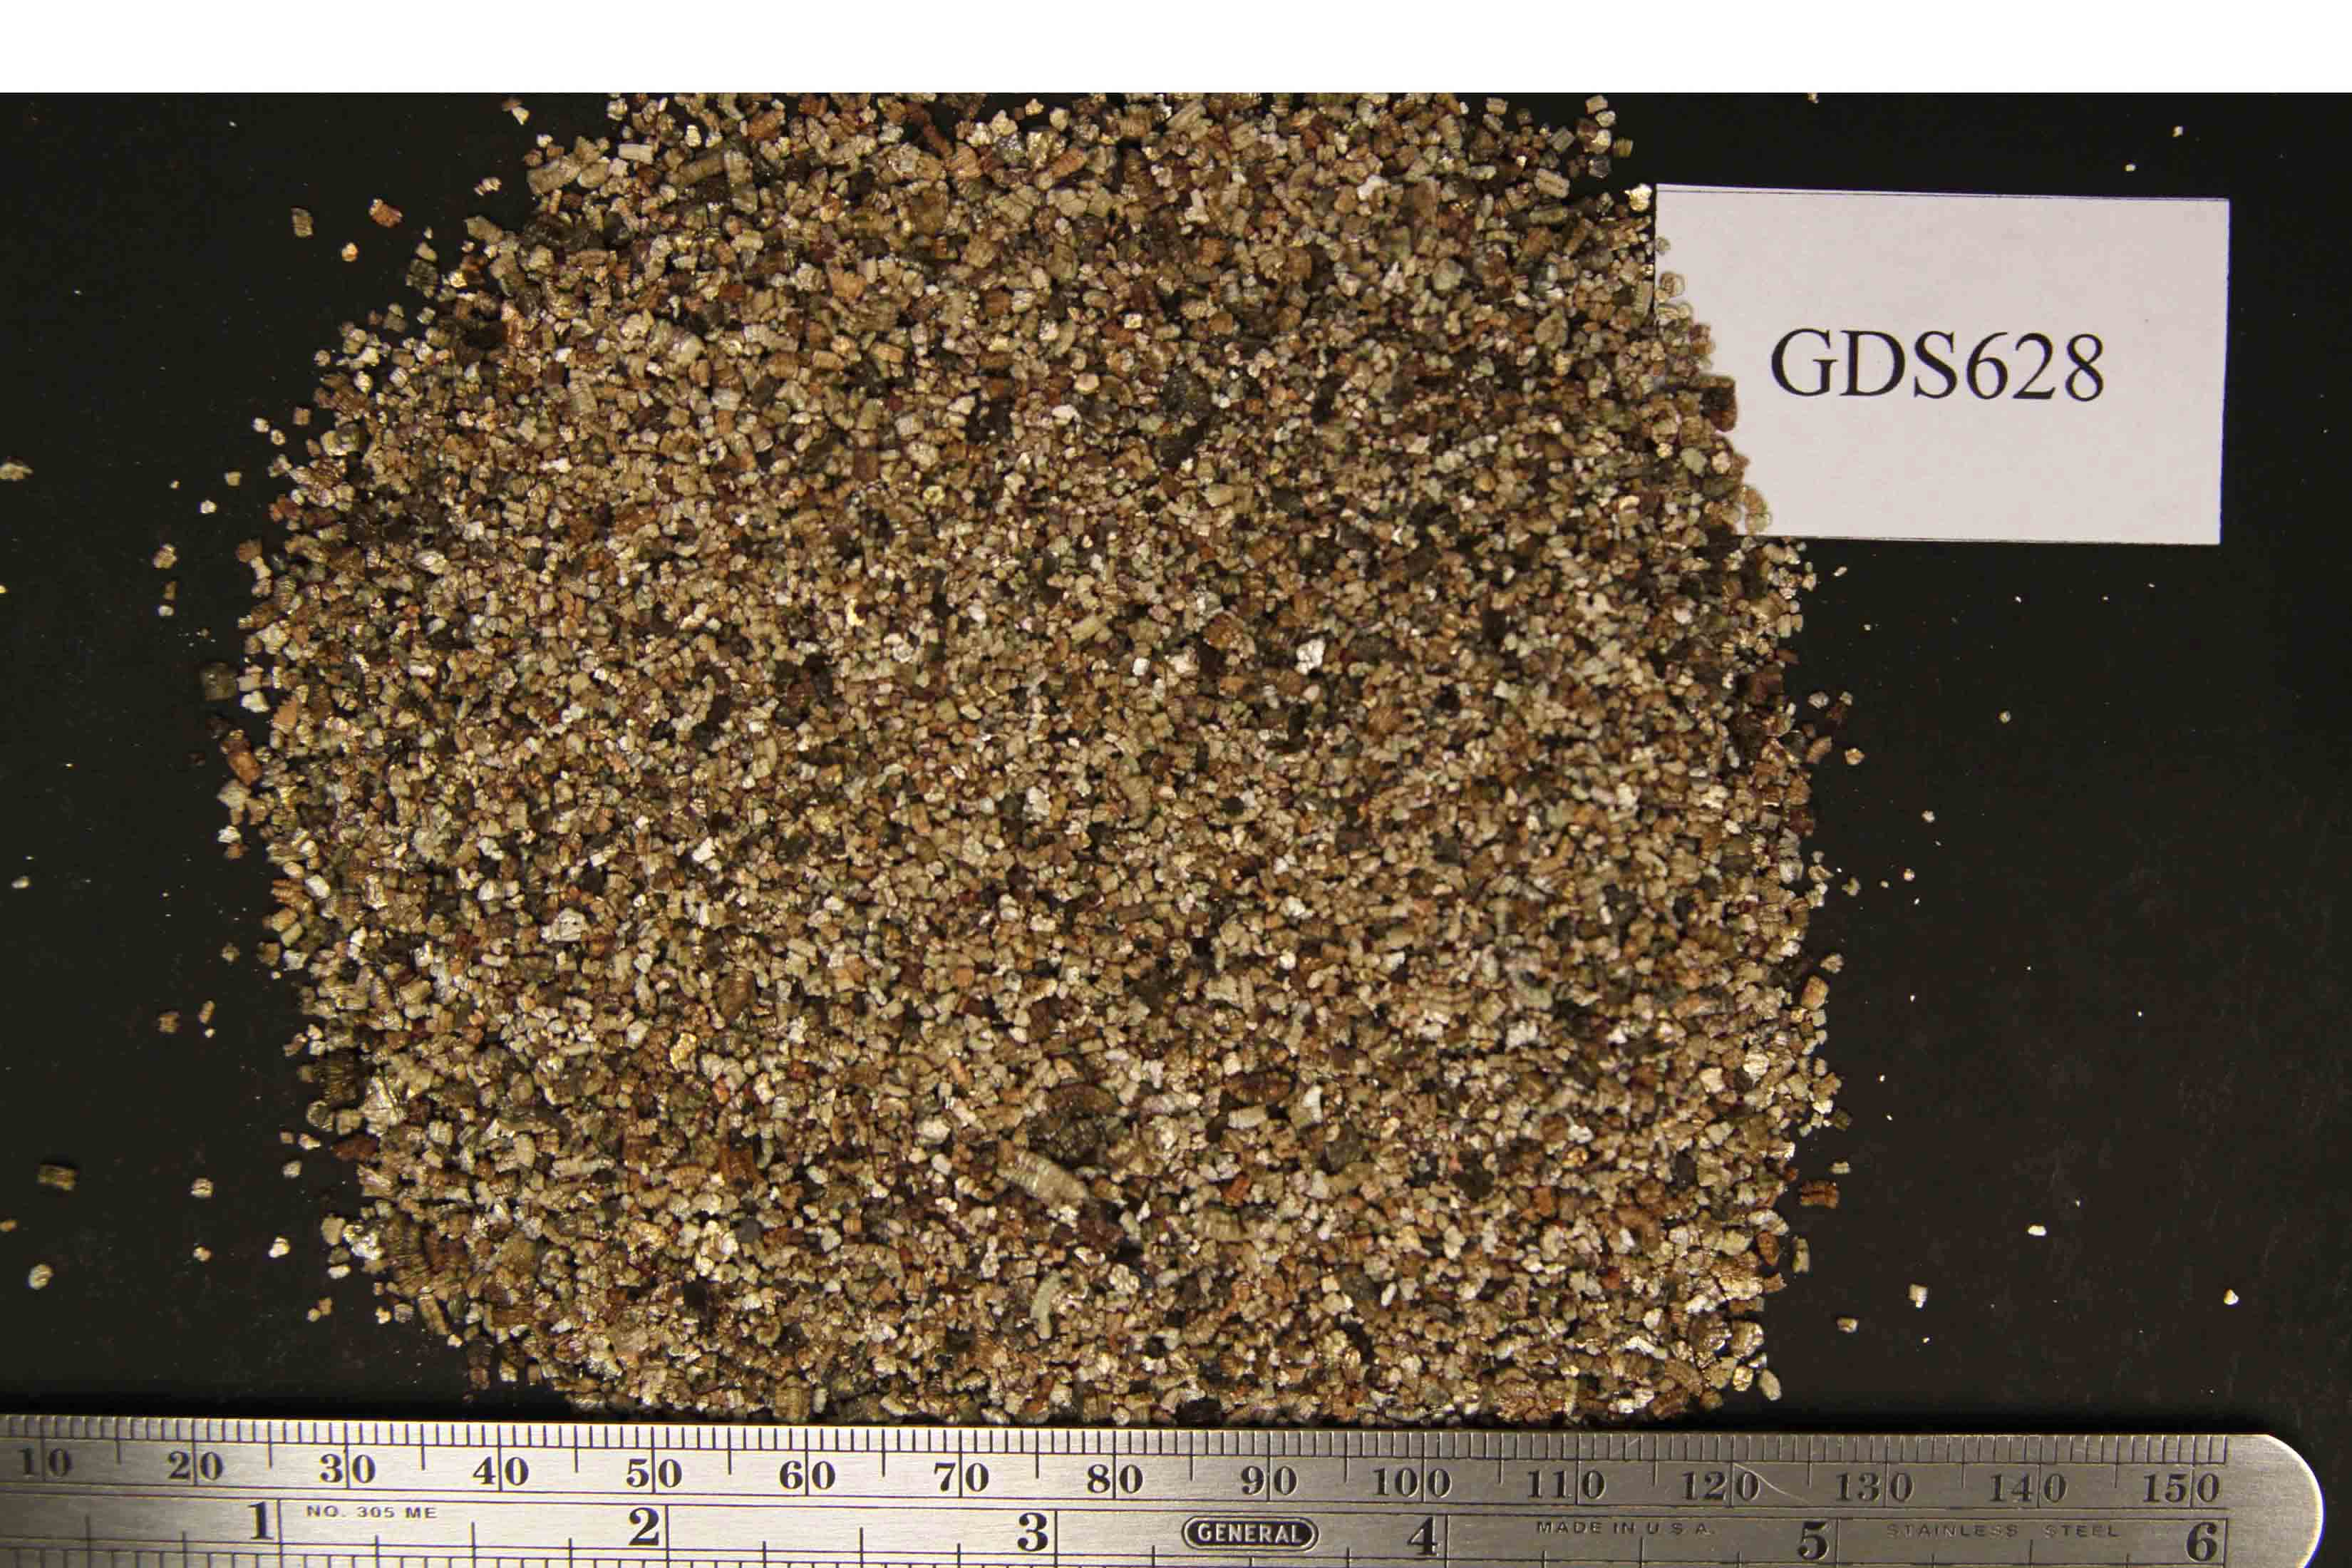
The sample has a mottled golden color with numerous dark grains and grain size 0.5 - 2 mm with rare grains about 6 mm in length (Fig. GDS628.photo.1).
A modified Cincinnati floation method was carried out on this sample. The sink fraction consists of mica flakes and small particles that were mounted on a stub for SEM examination.
The sample has a spectral signature similar to that of expanded vermiculite ore from Louisa, Virginia, USA.
Original spectrum published in:
IMAGE_OF_SAMPLE:
END_SAMPLE_DESCRIPTION.
XRD_ANALYSIS:
Rietveld refinement XRD analysis (limited quantities of sample and no internal standard) of the Cincinnati Method sink fraction indicates albite, amphibole, chlinochlore, quartz and talc with trace vermiculite and kaolinite (Fig. GDS628.XRD.2). Qualitative XRD analysis of the bulk sample indicates the presence of vermiculite, biotite, phlogopite, hydrobiotite, talc, and amphibole (Fig. GDS628.XRD.3).
END_XRD_ANALYSIS.
COMPOSITIONAL_ANALYSIS_TYPE: None # XRF, EPMA, ICP(Trace), WChem
COMPOSITION_TRACE: None
COMPOSITION_DISCUSSION:
The sample was examined with probe microanalysis. Spot analyses plot in the right two Enoree/Louisa fields on the Al/Ti versus Al/[Mg/(Mg+Fe)] diagram (Fig. GDS628.microprobe.1).
END_COMPOSITION_DISCUSSION.
MICROSCOPIC_EXAMINATION:
The sample was examined with SEM and Energy dispersive spectroscopy. Particles from the sink fraction were placed on an SEM stub, which was coated with carbon, and examined under high magnification. Points analyzed with EDS are shown in color on SEM micrographs that accompany the EDS spectra. Amphibole, likely tremolite was detected by EDS and SEM analyses (Figs. GDS628.EDS.1 and 2 and Fig. GDS628.SEM.1; Figs. GDS628.EDS.3 to 6 and GDS628.SEM.3). These amphibole particles are not particularly elongate relative to amphiboles detected in Enoree and Libby samples. No talc particles were found in the sink fraction.
END_MICROSCOPIC_EXAMINATION.
SPECTROSCOPIC_DISCUSSION:
The spectrum is typical for a sample with vermiculite. The 1.40/1.42 micron band depth ratio plots below the no detectable amphibole, talc, and serpentine line in Figures GDS628.spectrum.2 and 3. XRD analysis of the bulk sample did detect amphibole and talc at trace levels apparently at concentrations below the spectral detection limit (see information below). The spectral parameters plot in the Louisa field (Fig. GDS628.spectrum.2) and Louisa/Enoree field (Figs. GDS628.spectrum.3 and 4).
SPECTRAL_PURITY: 1b2_3_4_ # 1= 0.2-3, 2= 1.5-6, 3= 6-25, 4= 20-150 microns