
|
DOCUMENTATION_FORMAT: Man_Made
SAMPLE_ID: GDS627
MATERIAL_TYPE: Expanded Phyllosilicates
MATERIAL: Expanded Vermiculite Ore
FORMULA: (Mg,Fe2+,Al)3(Si,Al)4O10(OH)2.4H2O
FORMULA_HTML: (Mg,Fe2+,Al)3(Si,Al)4O10(OH)2.4H2O
COLLECTION_LOCALITY: This sample is from a bag of Hyponex Û horticultural vermiculite purchased locally in Denver, Colorado in 2001.
ORIGINAL_DONOR:
CURRENT_SAMPLE_LOCATION: USGS Denver, CO
ULTIMATE_SAMPLE_LOCATION: USGS Denver, CO
SAMPLE_DESCRIPTION:
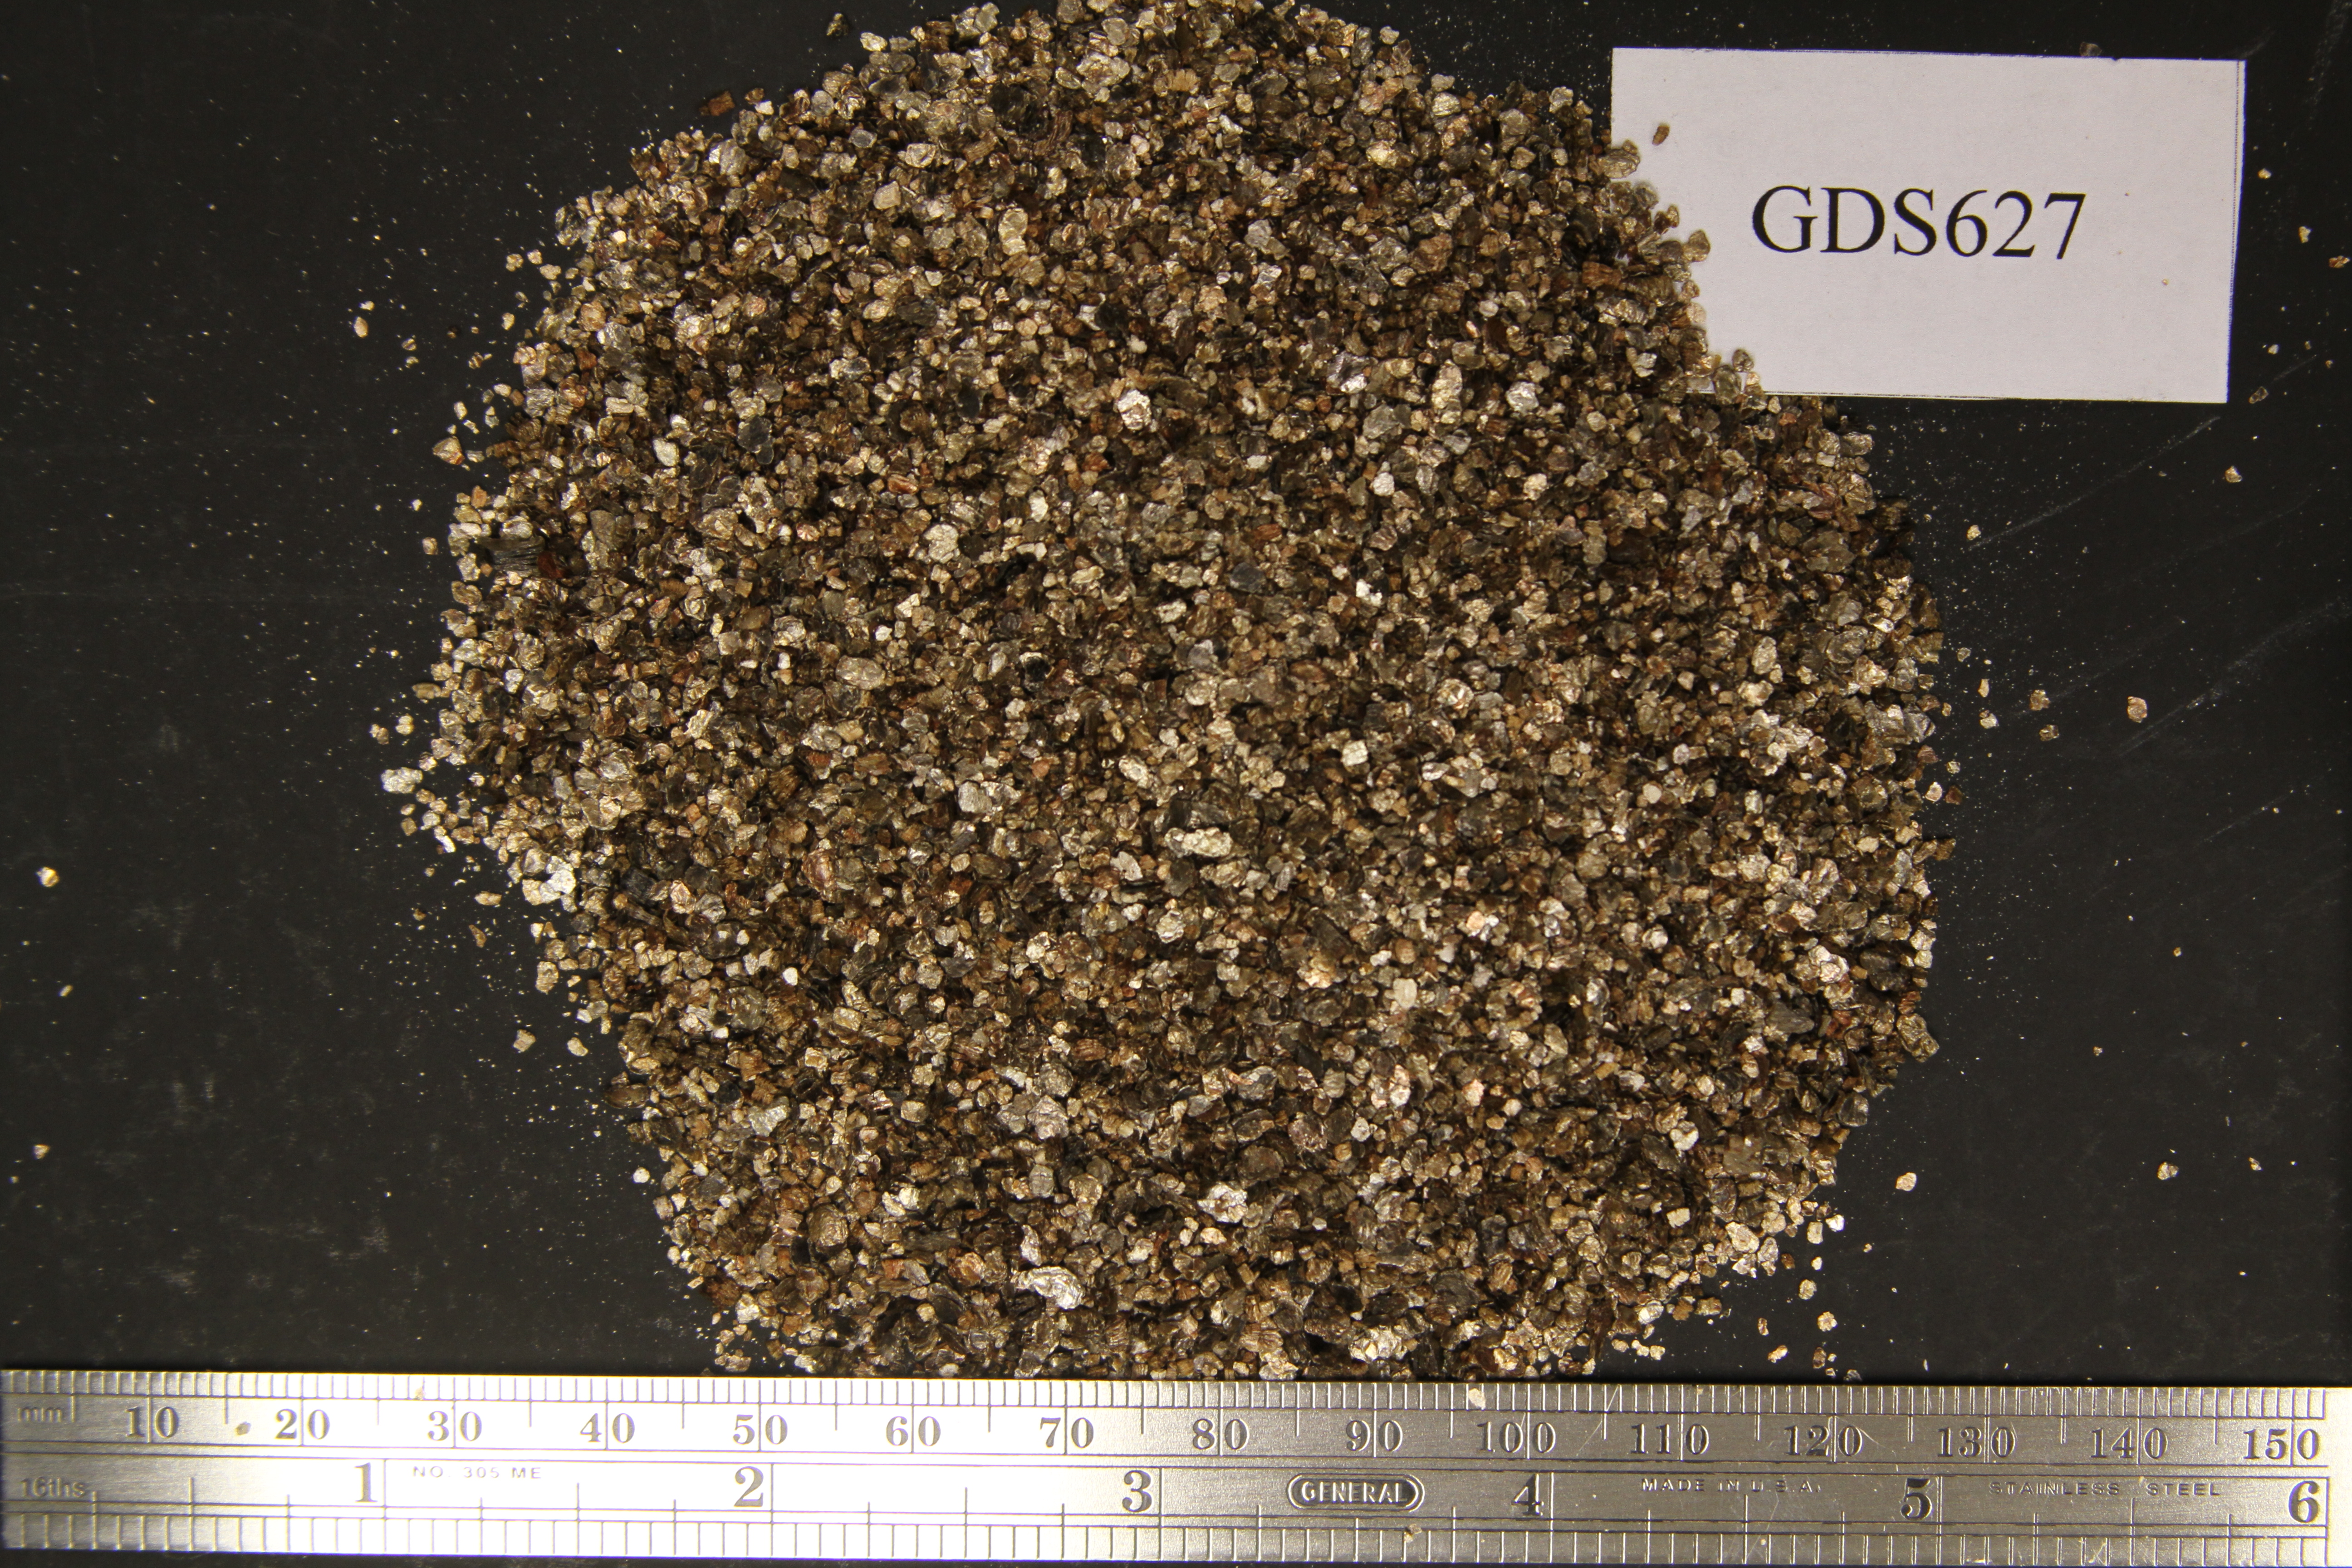
The sample has a mottled golden color with equal numbers of gold and dark grains that range in size from 0.5 4 mm (Fig. GDS627.photo.1).
A modified Cincinnati floation method was carried out on this sample. The sink fraction consists of mica flakes and small particles that were mounted on a stub for SEM examination.
The sample has a spectral signature similar to that of expanded vermiculite ore from Enoree, South Carolina, USA.
Original spectrum published in:
IMAGE_OF_SAMPLE:
END_SAMPLE_DESCRIPTION.
XRD_ANALYSIS:
Rietveld refinement XRD analysis (limited quantities of sample and no internal standard) of the Cincinnati Method sink fraction indicates the presence of major microcline, minor quartz, feldspar (including microcline), diopside, and talc (Fig. GDS627.XRD.2). Qualitative XRD analysis of the bulk sample indicates the presence of vermiculite, biotite, phlogopite, and possible amphibole (Fig. GDS627.XRD.3).
END_XRD_ANALYSIS.
COMPOSITIONAL_ANALYSIS_TYPE: None # XRF, EPMA, ICP(Trace), WChem
COMPOSITION_TRACE: None
COMPOSITION_DISCUSSION:
The sample was examined with probe microanalysis. Spot analyses on flakes from the sample plot in the central Enoree fields on the Al/Ti versus Al/[Mg/(Mg+Fe)] diagram (Fig. GDS627.microprobe.1). Two spot analyses plot in the Louisa, Virginia field.
END_COMPOSITION_DISCUSSION.
MICROSCOPIC_EXAMINATION:
The sample was examined with SEM and Energy dispersive spectroscopy. Particles from the sink fraction were placed on an SEM stub, which was coated with carbon, and examined under high magnification. Points analyzed with EDS are shown in color on SEM micrographs that accompany the EDS spectra. Elongate amphibole particles were detected based on EDS and SEM analyses (i.e., Figs. GDS627.EDS.15 and 16 and GDS627.SEM.8; GDS627.EDS.25 and 26 and GDS627.SEM.11). Curiously, no talc was detected on the SEM mounts, suggesting the presence of small talc grains that were not selected for mounting by hand on the SEM mounts. Apparently, the concentration of amphiboles is below the XRD detection limit in the sink fraction.
END_MICROSCOPIC_EXAMINATION.
SPECTROSCOPIC_DISCUSSION:
The spectrum is typical for a sample with vermiculite. The 1.40/1.42 micron band depth ratio indicates the presence of amphibole, talc, or serpentine probably at the few weight percent level. The shape of the grains of these contaminants cannot be discerned by spectroscopy. The spectral parameters plot in the Enoree/Jiangsu field (Fig. GDS627.spectrum.2) and Louisa/Enoree fields (Fig. GDS627.spectrum.3 and 4).
SPECTRAL_PURITY: 1b2_3_4_ # 1= 0.2-3, 2= 1.5-6, 3= 6-25, 4= 20-150 microns