
|
DOCUMENTATION_FORMAT: Man_Made
SAMPLE_ID: GDS450
MATERIAL_TYPE: Expanded Phyllosilicates
MATERIAL: Expanded Vermiculite Ore
FORMULA: (Mg,Fe2+,Al)3(Si,Al)4O10(OH)2.4H2O
FORMULA_HTML: (Mg,Fe2+,Al)3(Si,Al)4O10(OH)2.4H2O
COLLECTION_LOCALITY: This sample came from a bag of vermiculite attic insulation from a hardware store in Golden, Colorado in 2001 or 2002.
ORIGINAL_DONOR:
CURRENT_SAMPLE_LOCATION: USGS Denver, CO
ULTIMATE_SAMPLE_LOCATION: USGS Denver, CO
SAMPLE_DESCRIPTION:
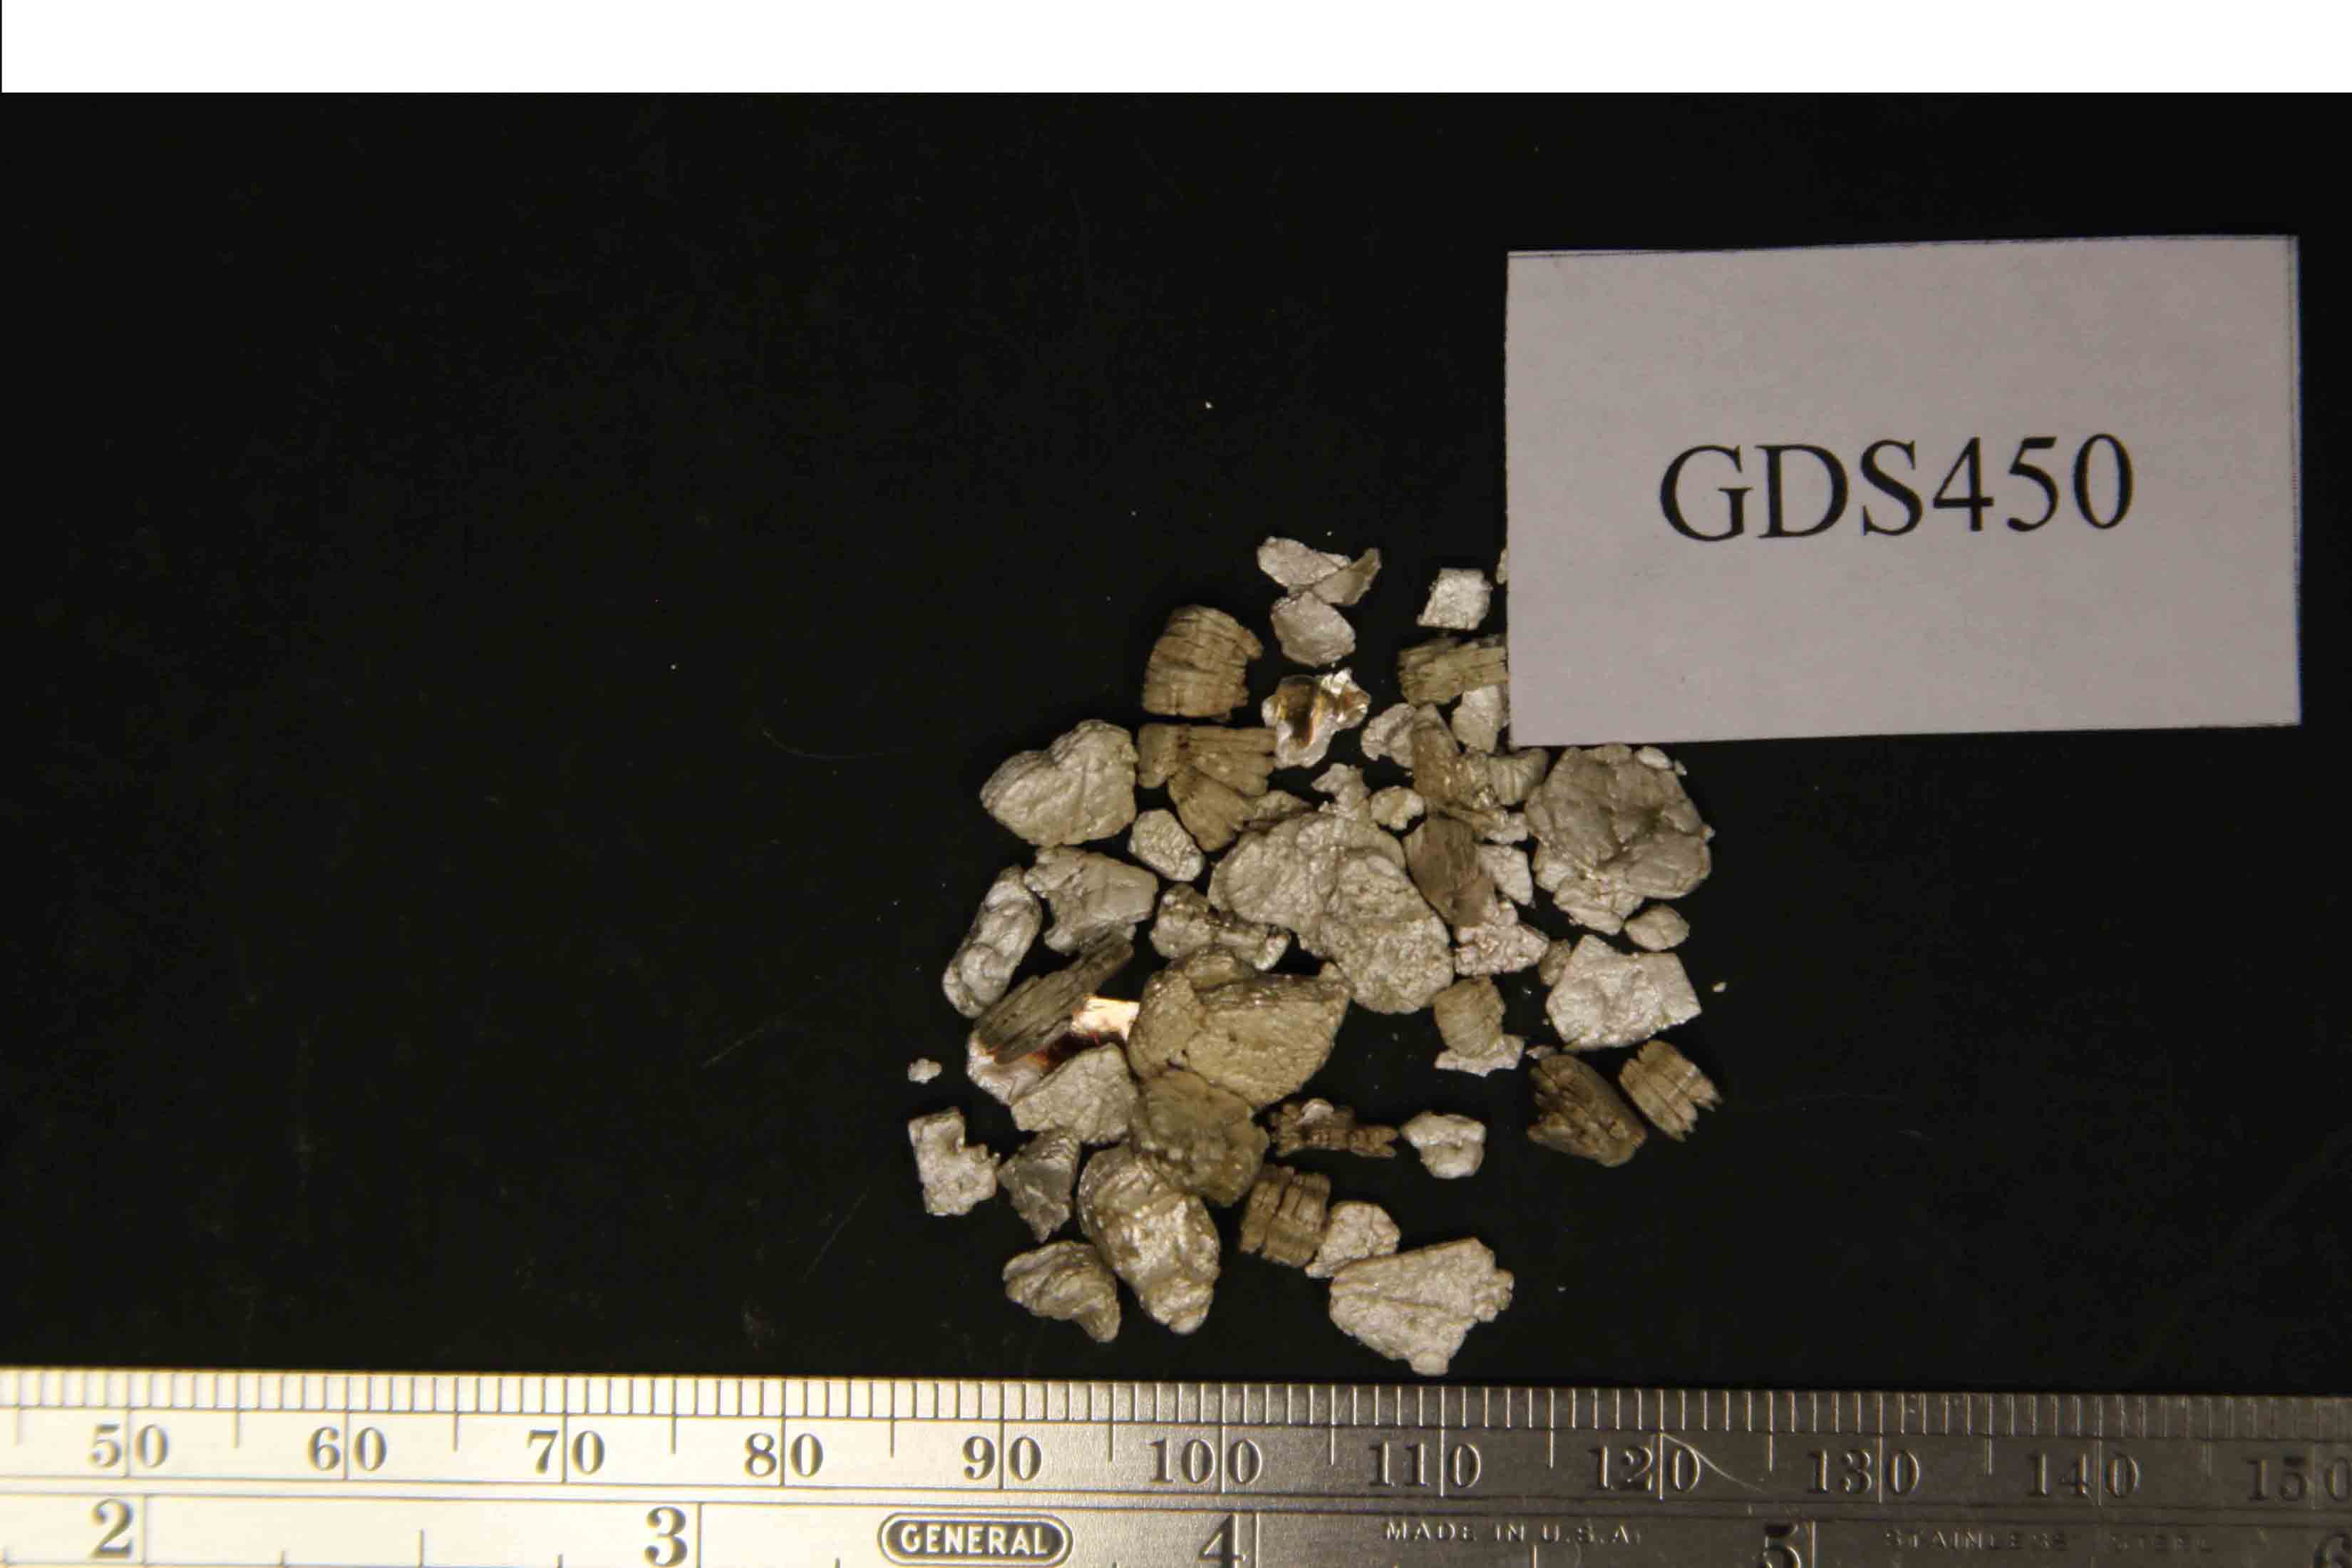
The sample has a golden color and grains range in size from 1 - 10 mm (Fig. GDS450.photo.1).
Because of the limited volume of this sample (< 100 cm3) the modified Cincinnati Method was not performed. Instead, a sample container dab from the bulk sample was collected on a stub for SEM examination.
The sample has a spectral signature similar to that of expanded vermiculite ore from two sources: it appears to be a mixture of Palabora Mine, Phalaborwa, South Africa ore and an ore from another unidentified source.
Original spectrum published in:
IMAGE_OF_SAMPLE:
END_SAMPLE_DESCRIPTION.
XRD_ANALYSIS:
Qualitative XRD analysis of the bulk sample indicates the presence of phlogopite, hyrobiotite, and biotite (Figs. GDS450.XRD.1 and 2).
END_XRD_ANALYSIS.
COMPOSITIONAL_ANALYSIS_TYPE: None # XRF, EPMA, ICP(Trace), WChem
COMPOSITION_TRACE: None
COMPOSITION_DISCUSSION:
Sample was examined with probe microanalysis. Spot analyses plot in the Palabora field on the Al/Ti versus Al/[Mg/(Mg+Fe)] diagram (Fig. GDS450.microprobe.1).
END_COMPOSITION_DISCUSSION.
MICROSCOPIC_EXAMINATION:
The sample was examined with SEM and Energy dispersive spectroscopy. The container lid was dabbed with an SEM stub, which was subsequently coated with carbon, and examined under high magnification. Points analyzed with EDS are shown in color on SEM micrographs that accompany the EDS spectra. No serpentine, talc, or amphibole grains were detected by SEM and EDS analyses.
END_MICROSCOPIC_EXAMINATION.
SPECTROSCOPIC_DISCUSSION:
The spectrum is typical for a sample with predominately hydrobiotite and phlogopite/biotite. The 1.40/1.42 micron band depth ratio plots above the “no detectable amphibole, talc, and serpentine” line in Figures GDS450.spectrum.2 and 3. The reflectance spectrum of this sample does not have a detectable 2.24-micron band so there is no symbol on Fig. GDS450.spectrum.4. The spectral parameters plot in the Mixtures field (Figs. GDS450.spectrum.2 and 3) indicating the presence of limited amounts of vermiculite from some other source that was not sampled by the microprobe analysis.
SPECTRAL_PURITY: 1b2_3_4_ # 1= 0.2-3, 2= 1.5-6, 3= 6-25, 4= 20-150 microns