
|
DOCUMENTATION_FORMAT: Man_Made
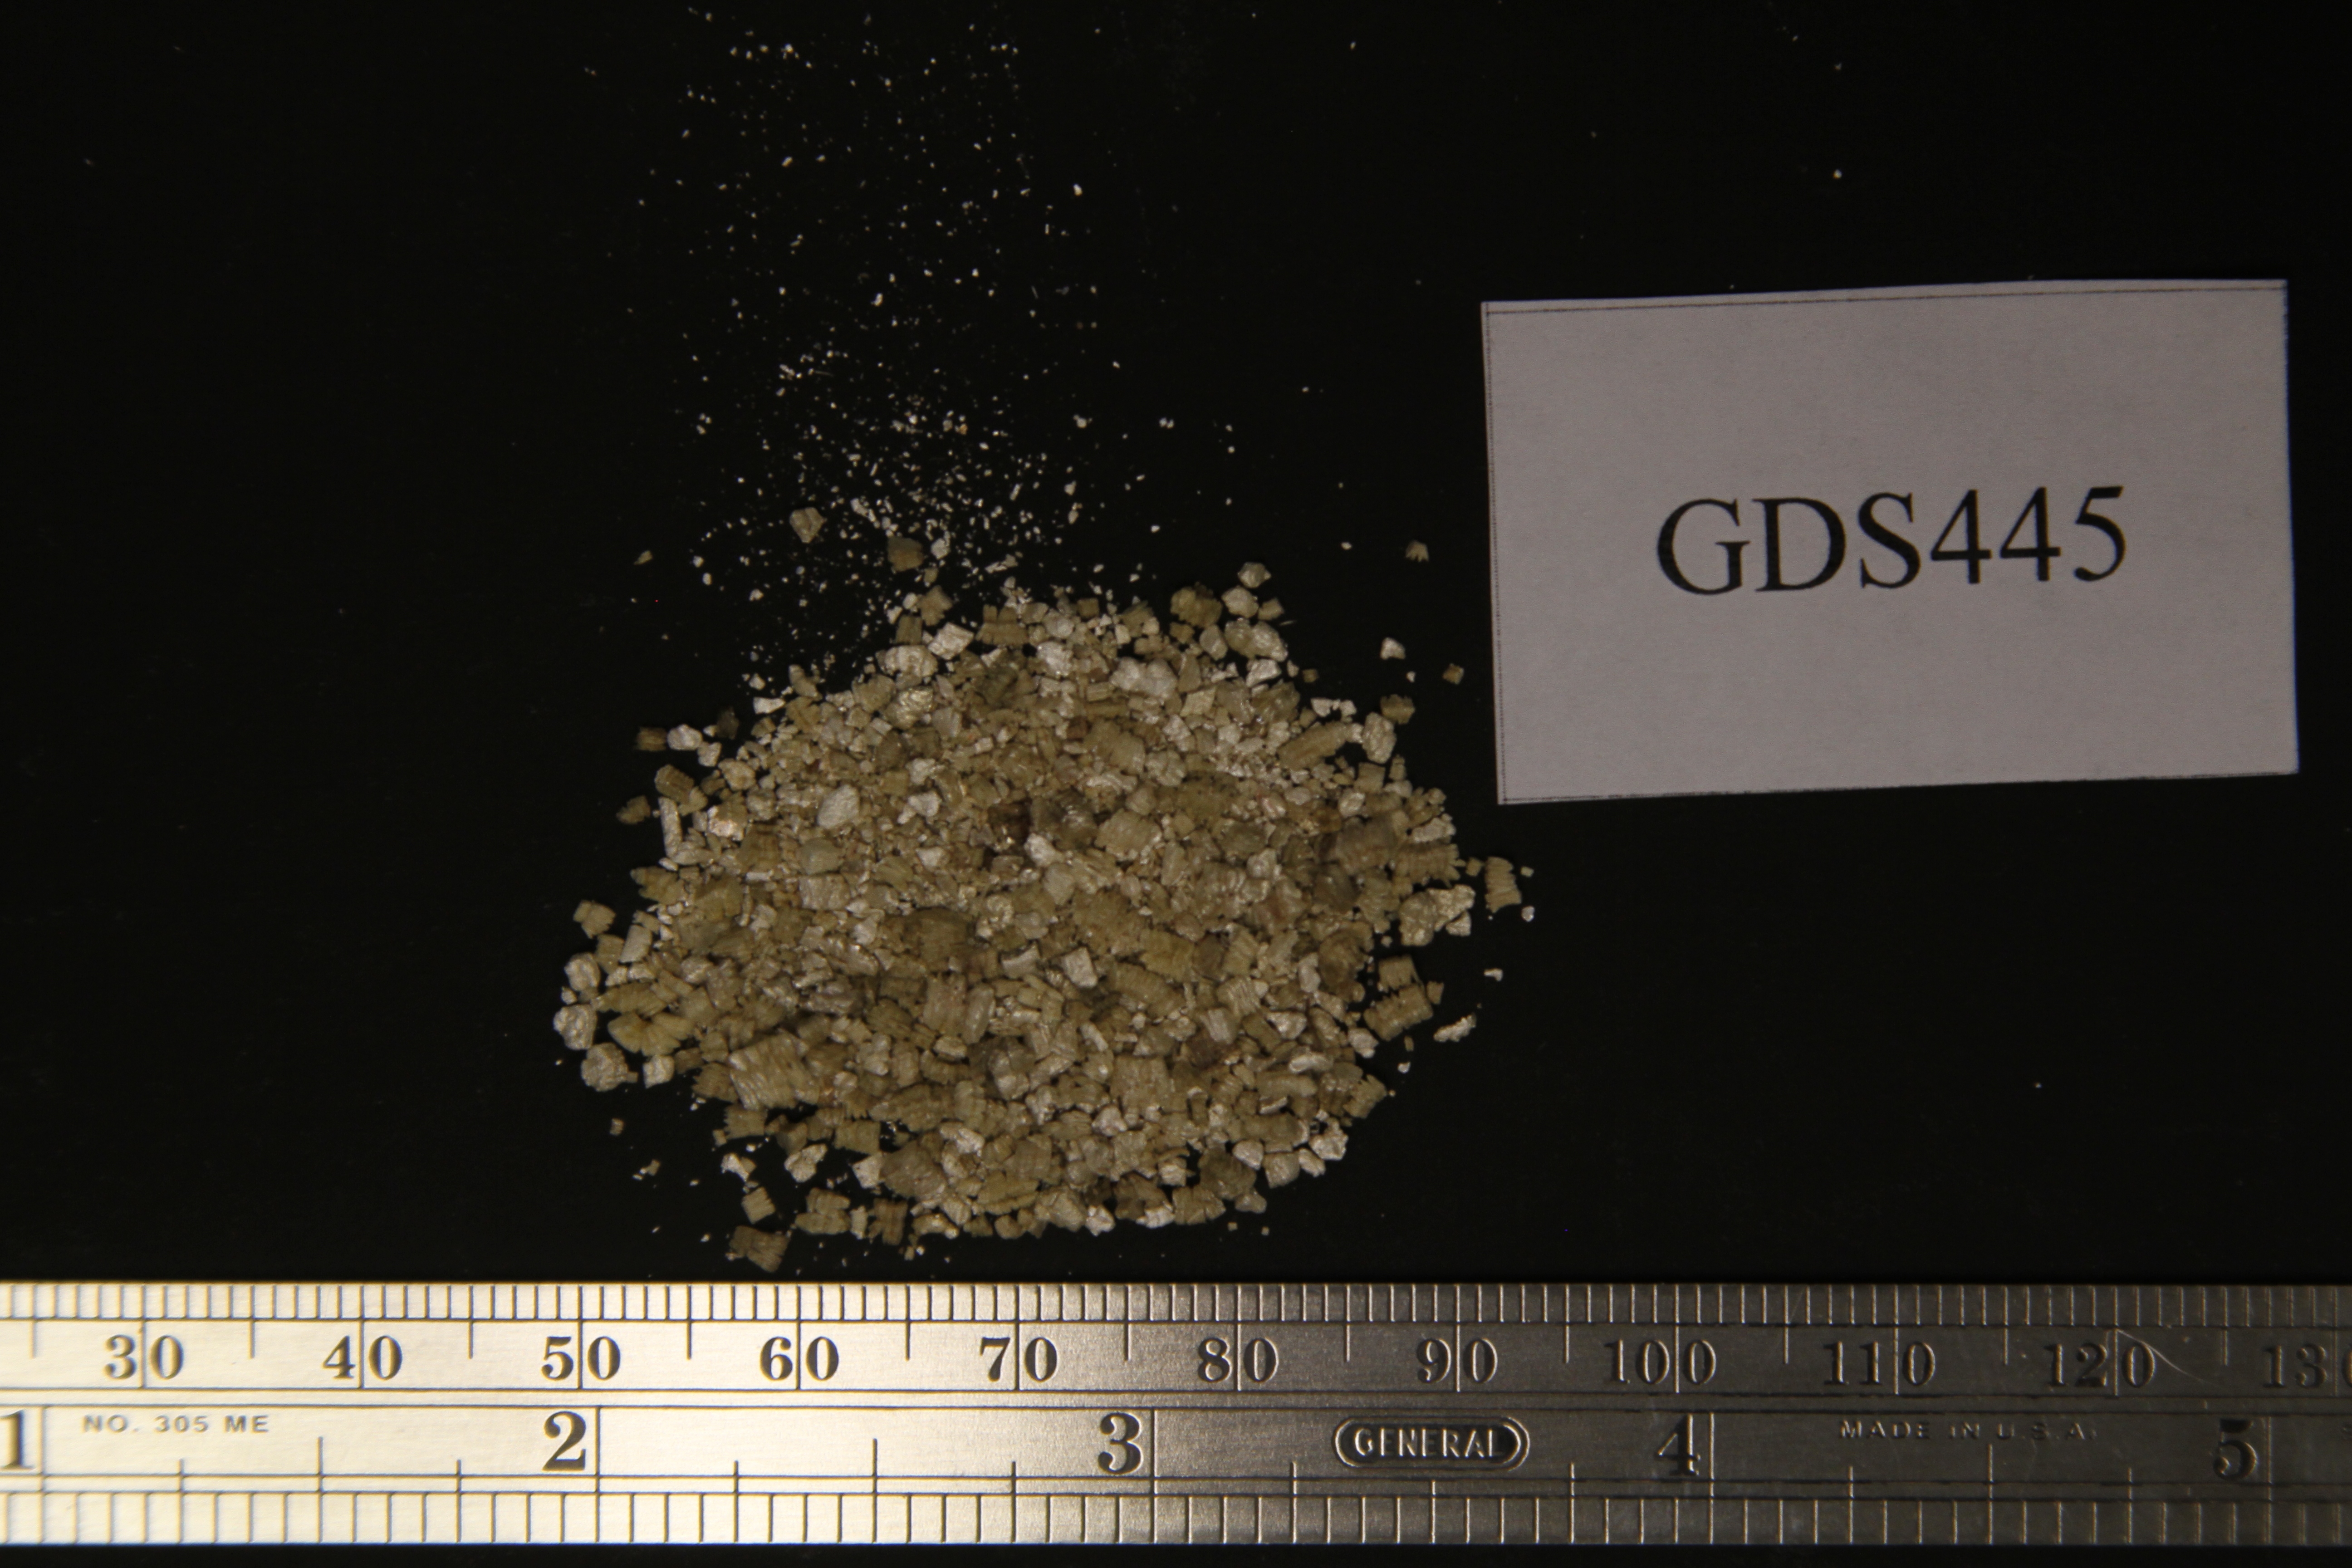
SAMPLE_ID: GDS445
MATERIAL_TYPE: Expanded Phyllosilicates
MATERIAL: Expanded Vermiculite Ore
FORMULA: (Mg,Fe2+,Al)3(Si,Al)4O10(OH)2.4H2O
FORMULA_HTML: (Mg,Fe2+,Al)3(Si,Al)4O10(OH)2.4H2O
COLLECTION_LOCALITY: This sample came from a bag of Terra Lite packing vermiculite collected in Denver during 2001 or 2002.
ORIGINAL_DONOR:
CURRENT_SAMPLE_LOCATION: USGS Denver, CO
ULTIMATE_SAMPLE_LOCATION: USGS Denver, CO
SAMPLE_DESCRIPTION:
The sample has a golden color with occasional tan colored grains and grains range in size from 0.25 - 4 mm (Fig. GDS445.photo.1).
Because of the limited volume of this sample (< 200 cm3) the modified Cincinnati Method was not performed. Instead, a sample container dab from the bulk sample was collected on a stub for SEM examination.
The sample has a spectral signature similar to that of expanded vermiculite ore from the Palabora Mine, Phalaborwa, South Africa.
Original spectrum published in:
IMAGE_OF_SAMPLE:
END_SAMPLE_DESCRIPTION.
XRD_ANALYSIS:
No XRD analysis is available for this sample.
END_XRD_ANALYSIS.
COMPOSITIONAL_ANALYSIS_TYPE: None # XRF, EPMA, ICP(Trace), WChem
COMPOSITION_TRACE: None
COMPOSITION_DISCUSSION:
The sample was examined with probe microanalysis. Spot analyses plot in the Palabora field on the Al/Ti versus Al/[Mg/(Mg+Fe)] diagram (Fig. GDS445.microprobe.1). Two probe spots plot just above the Palabora field but below the Enoree field.
END_COMPOSITION_DISCUSSION.
MICROSCOPIC_EXAMINATION:
The container lid was dabbed with an SEM stub, which was subsequently coated with carbon, and examined under high magnification. Points analyzed with EDS are shown in color on SEM micrographs that accompany the EDS spectra. A prismatic talc or anthophyllite mineral particle was found based on EDS (Figs. GDS445.EDS.1 and 2) and SEM (Fig. GDS445.SEM.1) analyses. An elongate serpentine grain was also found based on EDS (Figs. GDS445.EDS.21 and 22) and SEM (GDS445.SEM.4) analyses. Serpentine and possible blocky anthophyllite grains were rare. No elongate amphibole grains were found.
END_MICROSCOPIC_EXAMINATION.
SPECTROSCOPIC_DISCUSSION:
Average spectrum typical for a sample with predominately hydrobiotite and phlogopite/biotite. The 1.40/1.42 micron band depth ratio plots just above the “no detectable amphibole, talc, and serpentine” line in Figures GDS445.spectrum.2 and 3. The reflectance spectrum of this sample does not have a detectable 2.24-micron band so there is no symbol on Fig. GDS445.spectrum.4. The spectral parameters plot in the Palabora field (Figs. GDS445.spectrum.2 and 3).
SPECTRAL_PURITY: 1b2_3_4_ # 1= 0.2-3, 2= 1.5-6, 3= 6-25, 4= 20-150 microns