
|
DOCUMENTATION_FORMAT: Man_Made
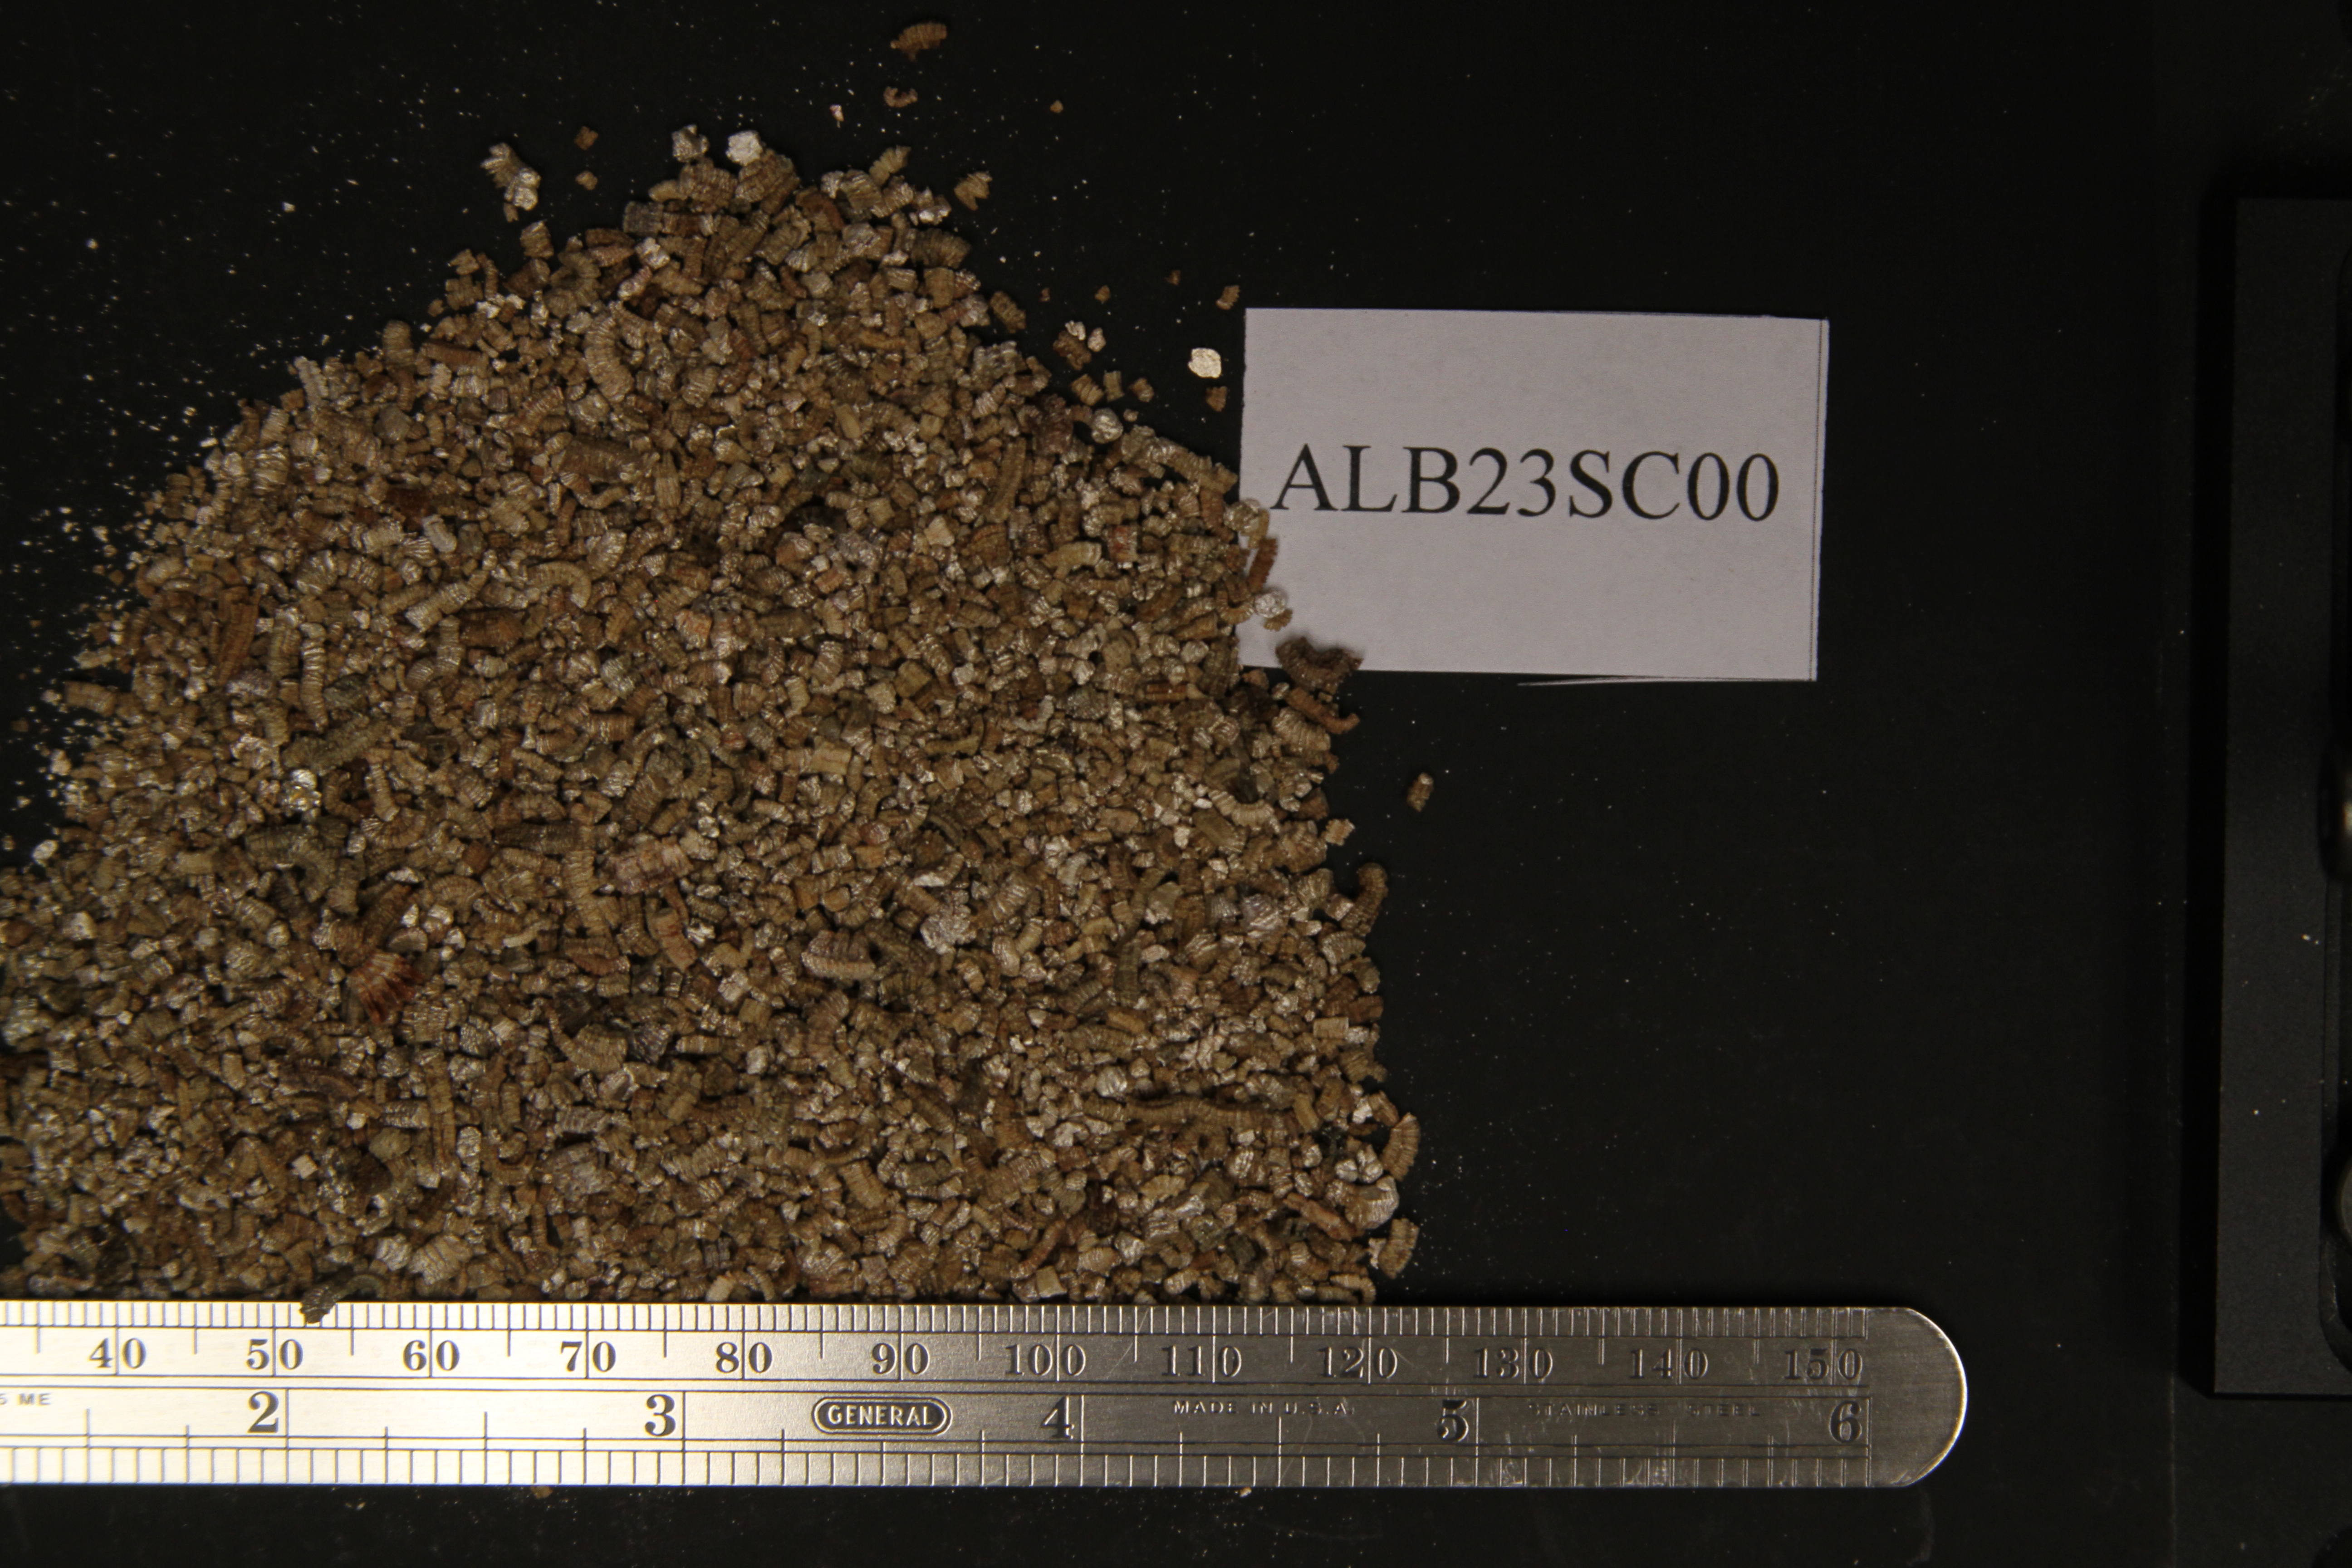
SAMPLE_ID: ALB23SC00
MATERIAL_TYPE: Expanded Phyllosilicates
MATERIAL: Expanded Vermiculite Ore
FORMULA: (Mg,Fe2+,Al)3(Si,Al)4O10(OH)2.4H2O
FORMULA_HTML: (Mg,Fe2+,Al)3(Si,Al)4O10(OH)2.4H2O
COLLECTION_LOCALITY: This expanded ore sample is from the Al Bush vermiculite collection housed at the U.S. Geological Survey in Denver. It was collected from Spartanburg, South Carolina.
ORIGINAL_DONOR: Al Bush vermiculite collection
CURRENT_SAMPLE_LOCATION: USGS Denver, CO
ULTIMATE_SAMPLE_LOCATION: USGS Denver, CO
SAMPLE_DESCRIPTION: The sample has a mottled golden color with occasional dark grains and grains range in size from 0.5 - 5 mm (Fig. ALB23SC00.photo.1).
Because of the limited volume of this sample (< 200 cm3) the modified Cincinnati Method was not performed. Instead, a sample container dab from the bulk sample was collected on a stub for SEM examination.
The sample has a spectral signature similar to that of expanded vermiculite ore from Enoree, South Carolina, USA.
Original spectrum published in:
IMAGE_OF_SAMPLE:
END_SAMPLE_DESCRIPTION.
XRD_ANALYSIS:
Rietveld refinement XRD analysis (limited quantities of sample and no internal standard) of the bulk sample indicates the presence of major phlogopite, minor vermiculite, and trace of clinochlore (Fig. ALB23SC00.XRD.2). It is worth noting that expansion of vermiculite during processing may destroy long-range crystallographic order and that unexpandable phases like phlogopite and clinochlore may dominate in x-ray diffraction measurements in expanded vermiculite ore.
END_XRD_ANALYSIS.
COMPOSITIONAL_ANALYSIS_TYPE: None # XRF, EPMA, ICP(Trace), WChem
COMPOSITION_TRACE: None
COMPOSITION_DISCUSSION:
The sample was examined with probe microanalysis. Spot analyses of an unexpanded equivalent Zonolite 3 raw ore plot in the Enoree fields on the Al/Ti versus Al/[Mg/(Mg+Fe)] diagram (Fig. ALB23SC00.microprobe.1).
END_COMPOSITION_DISCUSSION.
MICROSCOPIC_EXAMINATION:
The sample was examined with SEM and Energy dispersive spectroscopy. The container lid was dabbed with an SEM stub, which was coated with carbon, and examined under high magnification. Points analyzed with EDS are shown in color on SEM micrographs that accompany the EDS spectra. A prismatic diopside grain was found based on SEM (Fig. ALB23SC00.SEM.3) and EDS analyses (Figs. ALB23SC00.EDS.5 and 6). No elongate amphibole grains were found.
END_MICROSCOPIC_EXAMINATION.
SPECTROSCOPIC_DISCUSSION:
This is a spectrum typical for a sample with vermiculite. The 1.40/1.42 micron band depth ratio indicates the presence of amphibole, talc, or serpentine probably at the few weight percent level. The shapes of the grains of these contaminants cannot be discerned by spectroscopy. The spectral parameters plot in the Enoree/Jiangsu fields (Figs. ALB23SC00.spectrum.2 to 4).
SPECTRAL_PURITY: 1b2_3_4_ # 1= 0.2-3, 2= 1.5-6, 3= 6-25, 4= 20-150 microns