
|
DOCUMENTATION_FORMAT: PLANT
SAMPLE_ID: CA01-HEAR-1
PLANT_TYPE: California chaparral perennial shrub
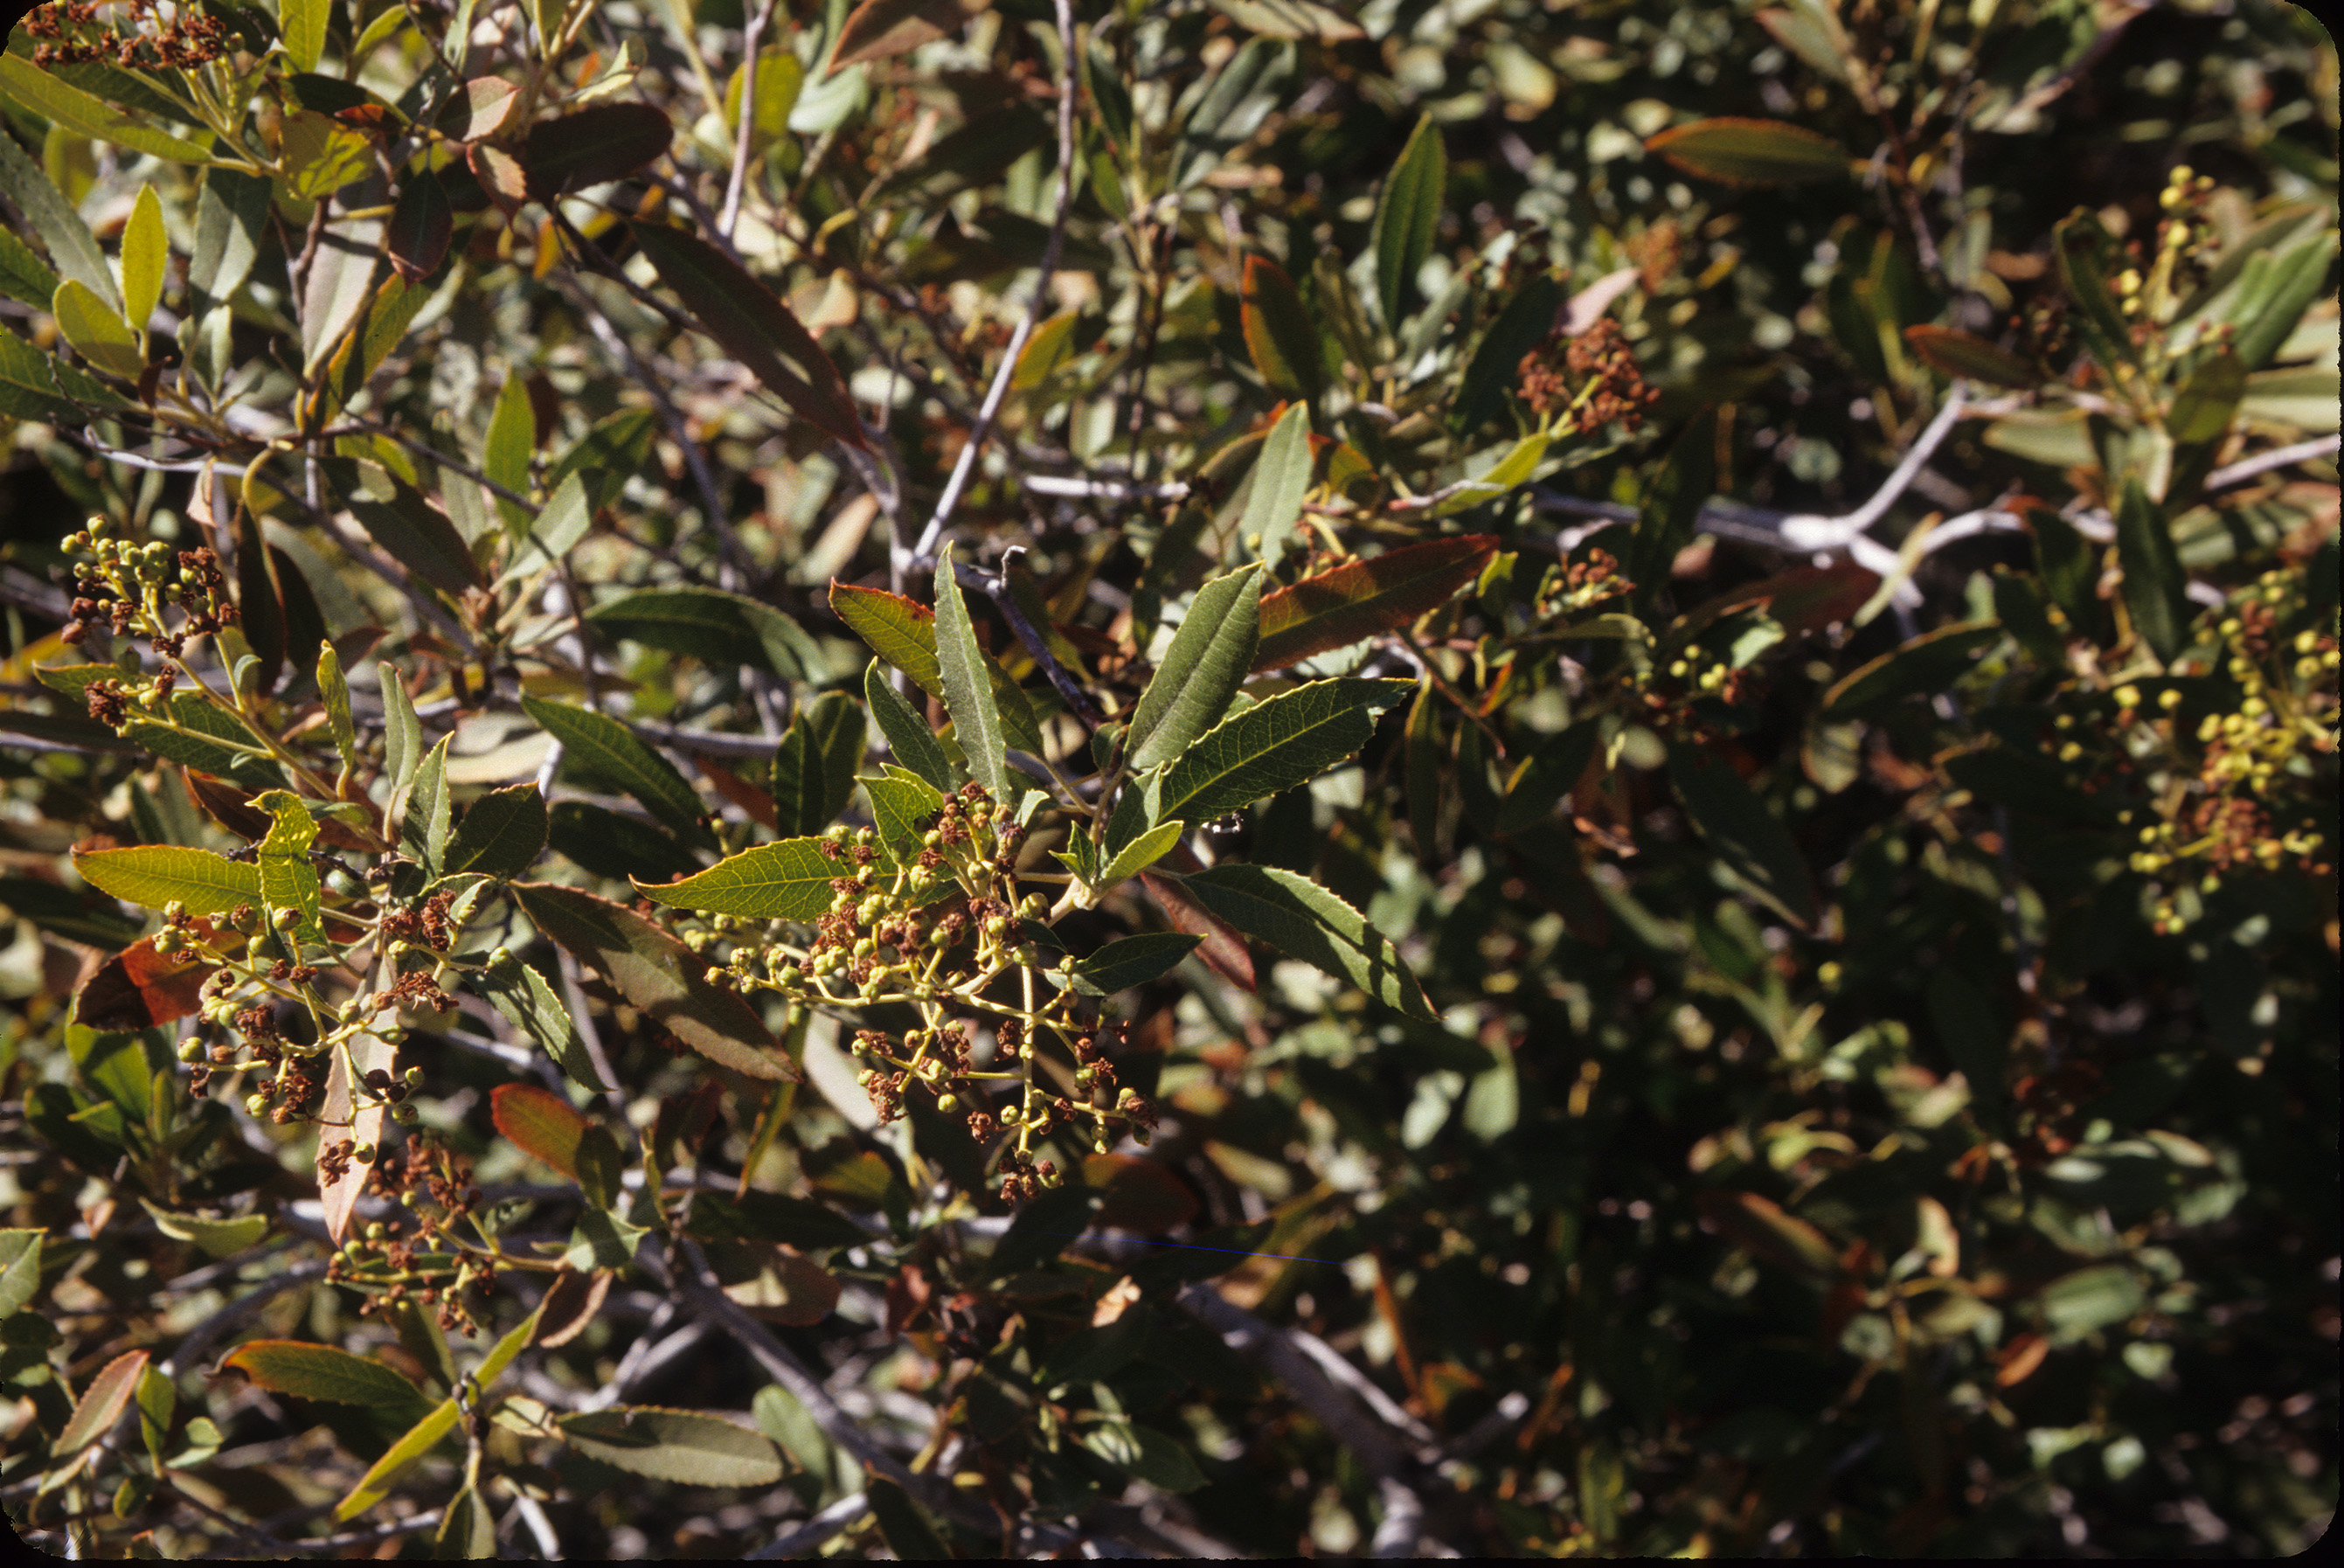
PLANT: Toyon
LATIN_NAME: Heteromeles arbutifolia (Lindl.) M. Roem.
COLLECTION_LOCALITY: Flagstaff Hill, in El Dorado county, approximately 42 km northeast of Sacramento, California
COLLECTION_LATITUDE: 38.782129 deg. N
COLLECTION_LONGITUDE: 121.083016 deg. W
DATUM: WGS-84
ORIGINAL_DONOR: Raymond F. Kokaly, USGS
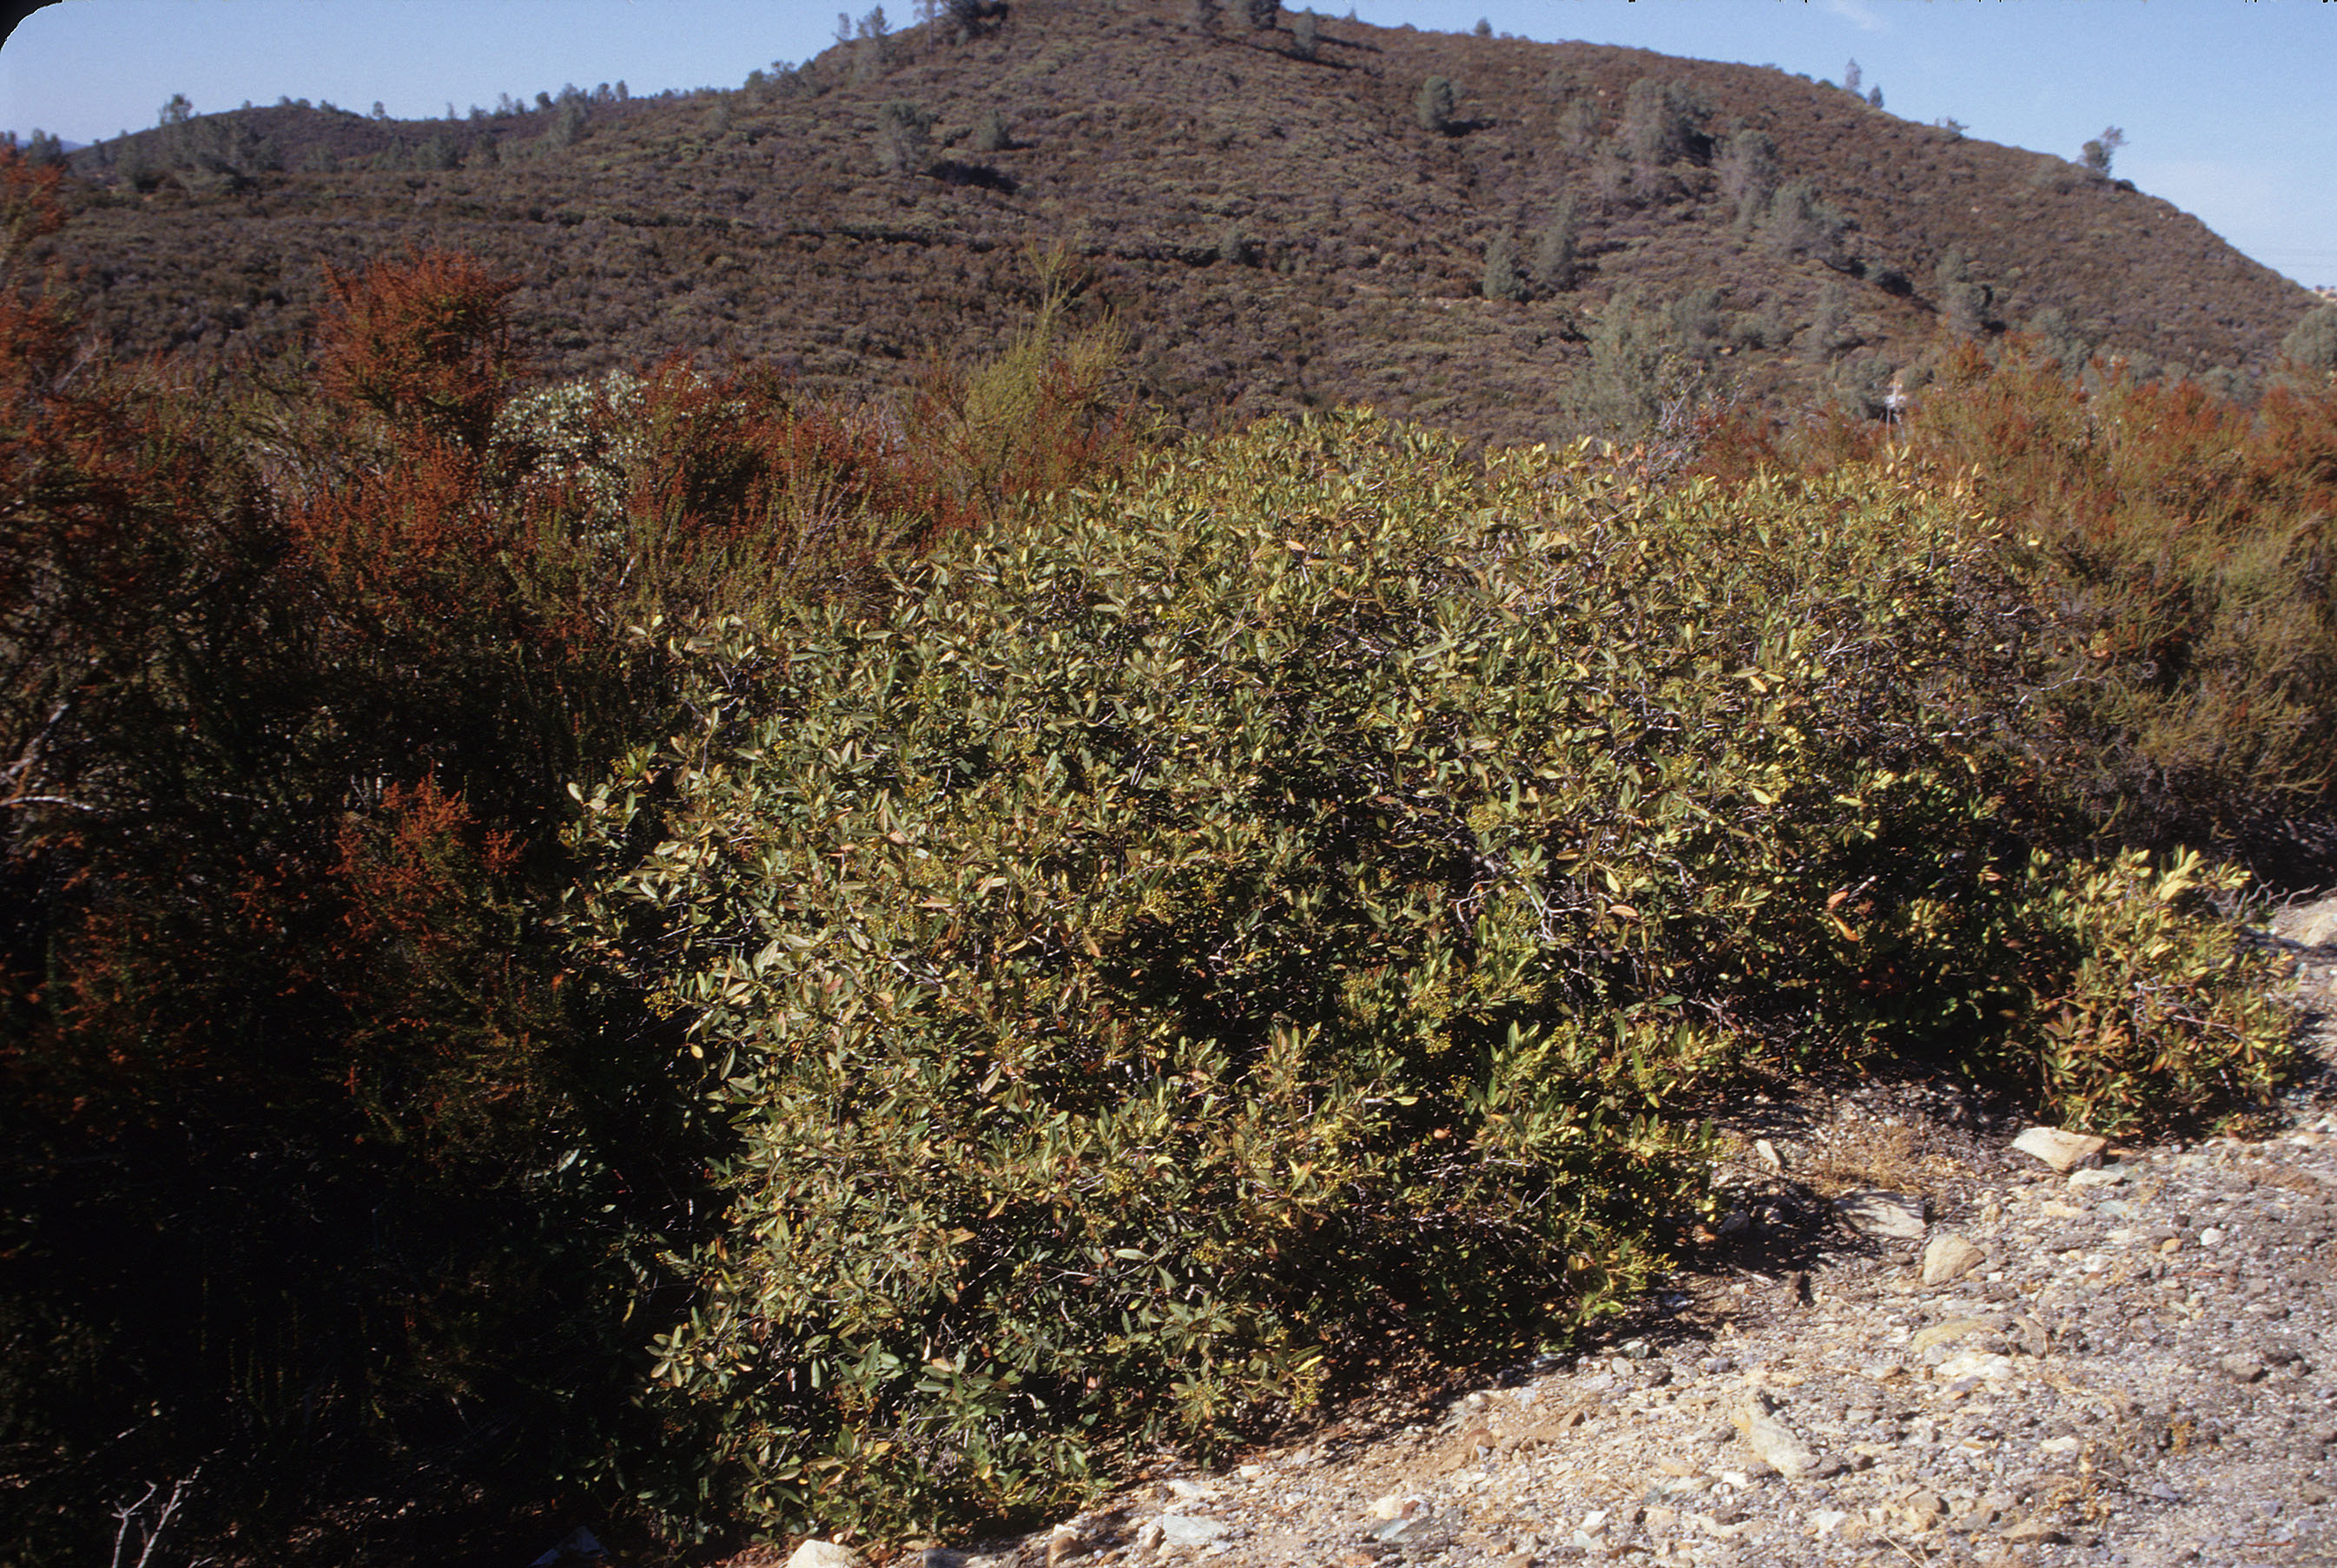
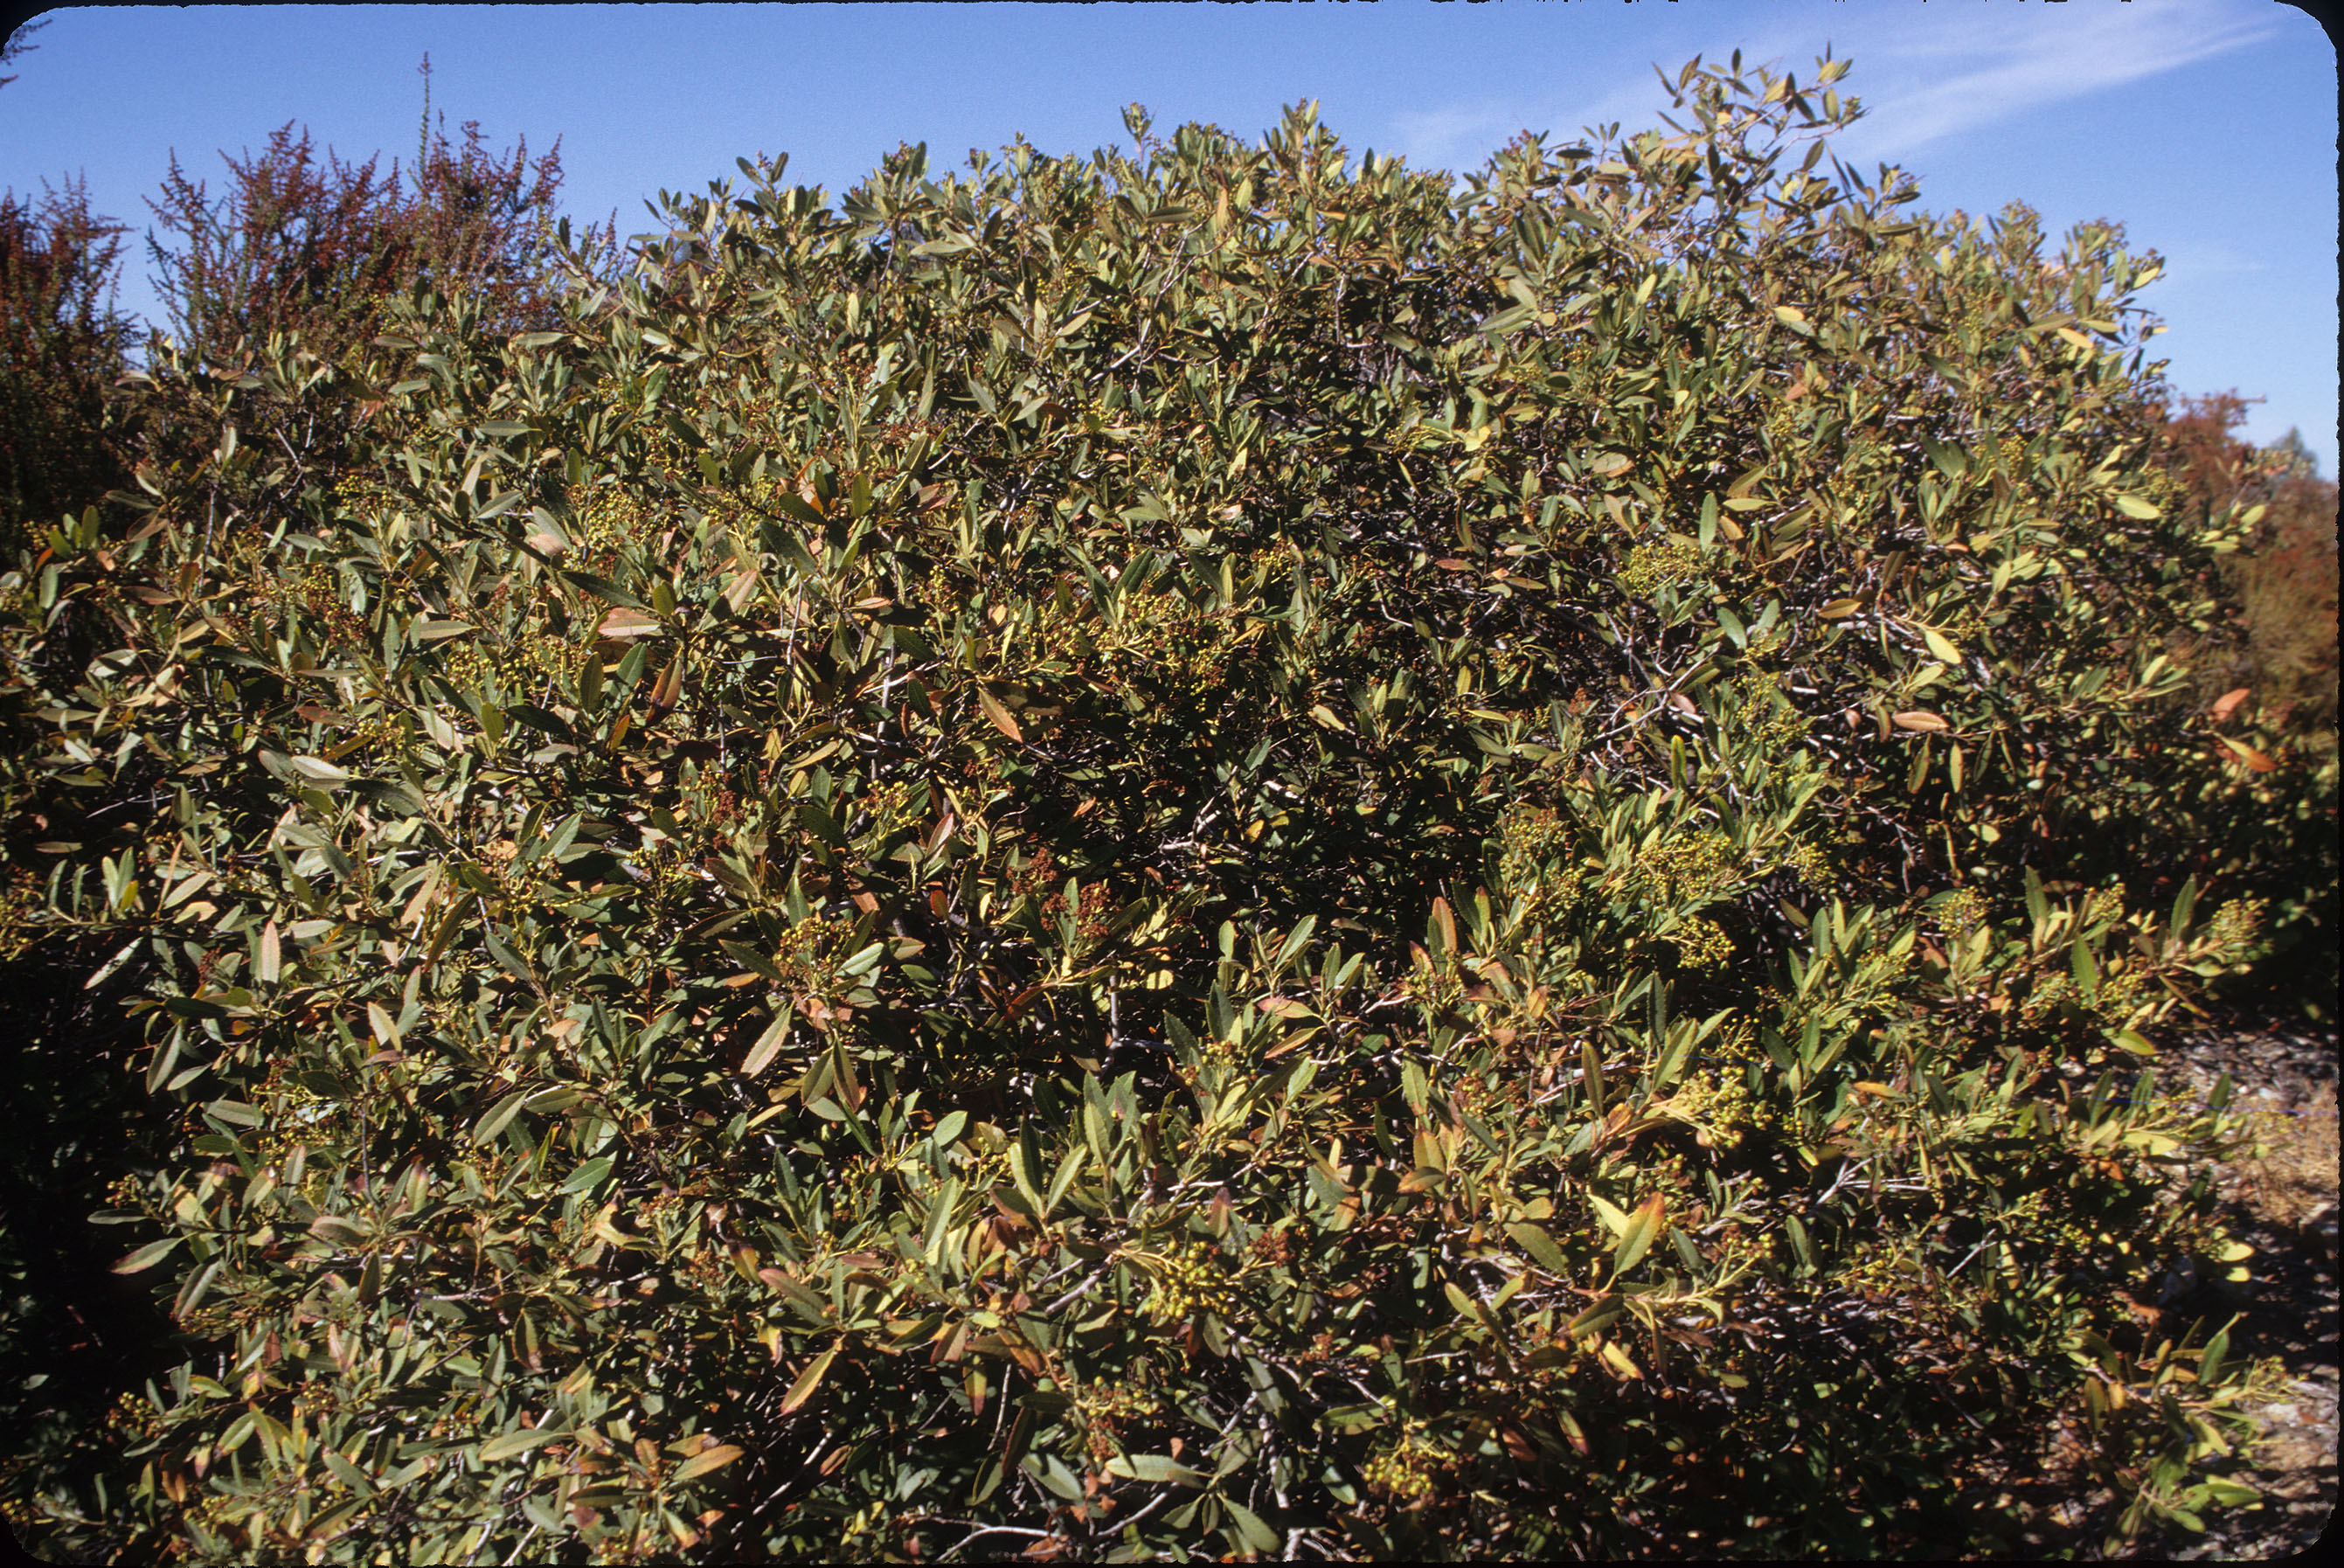
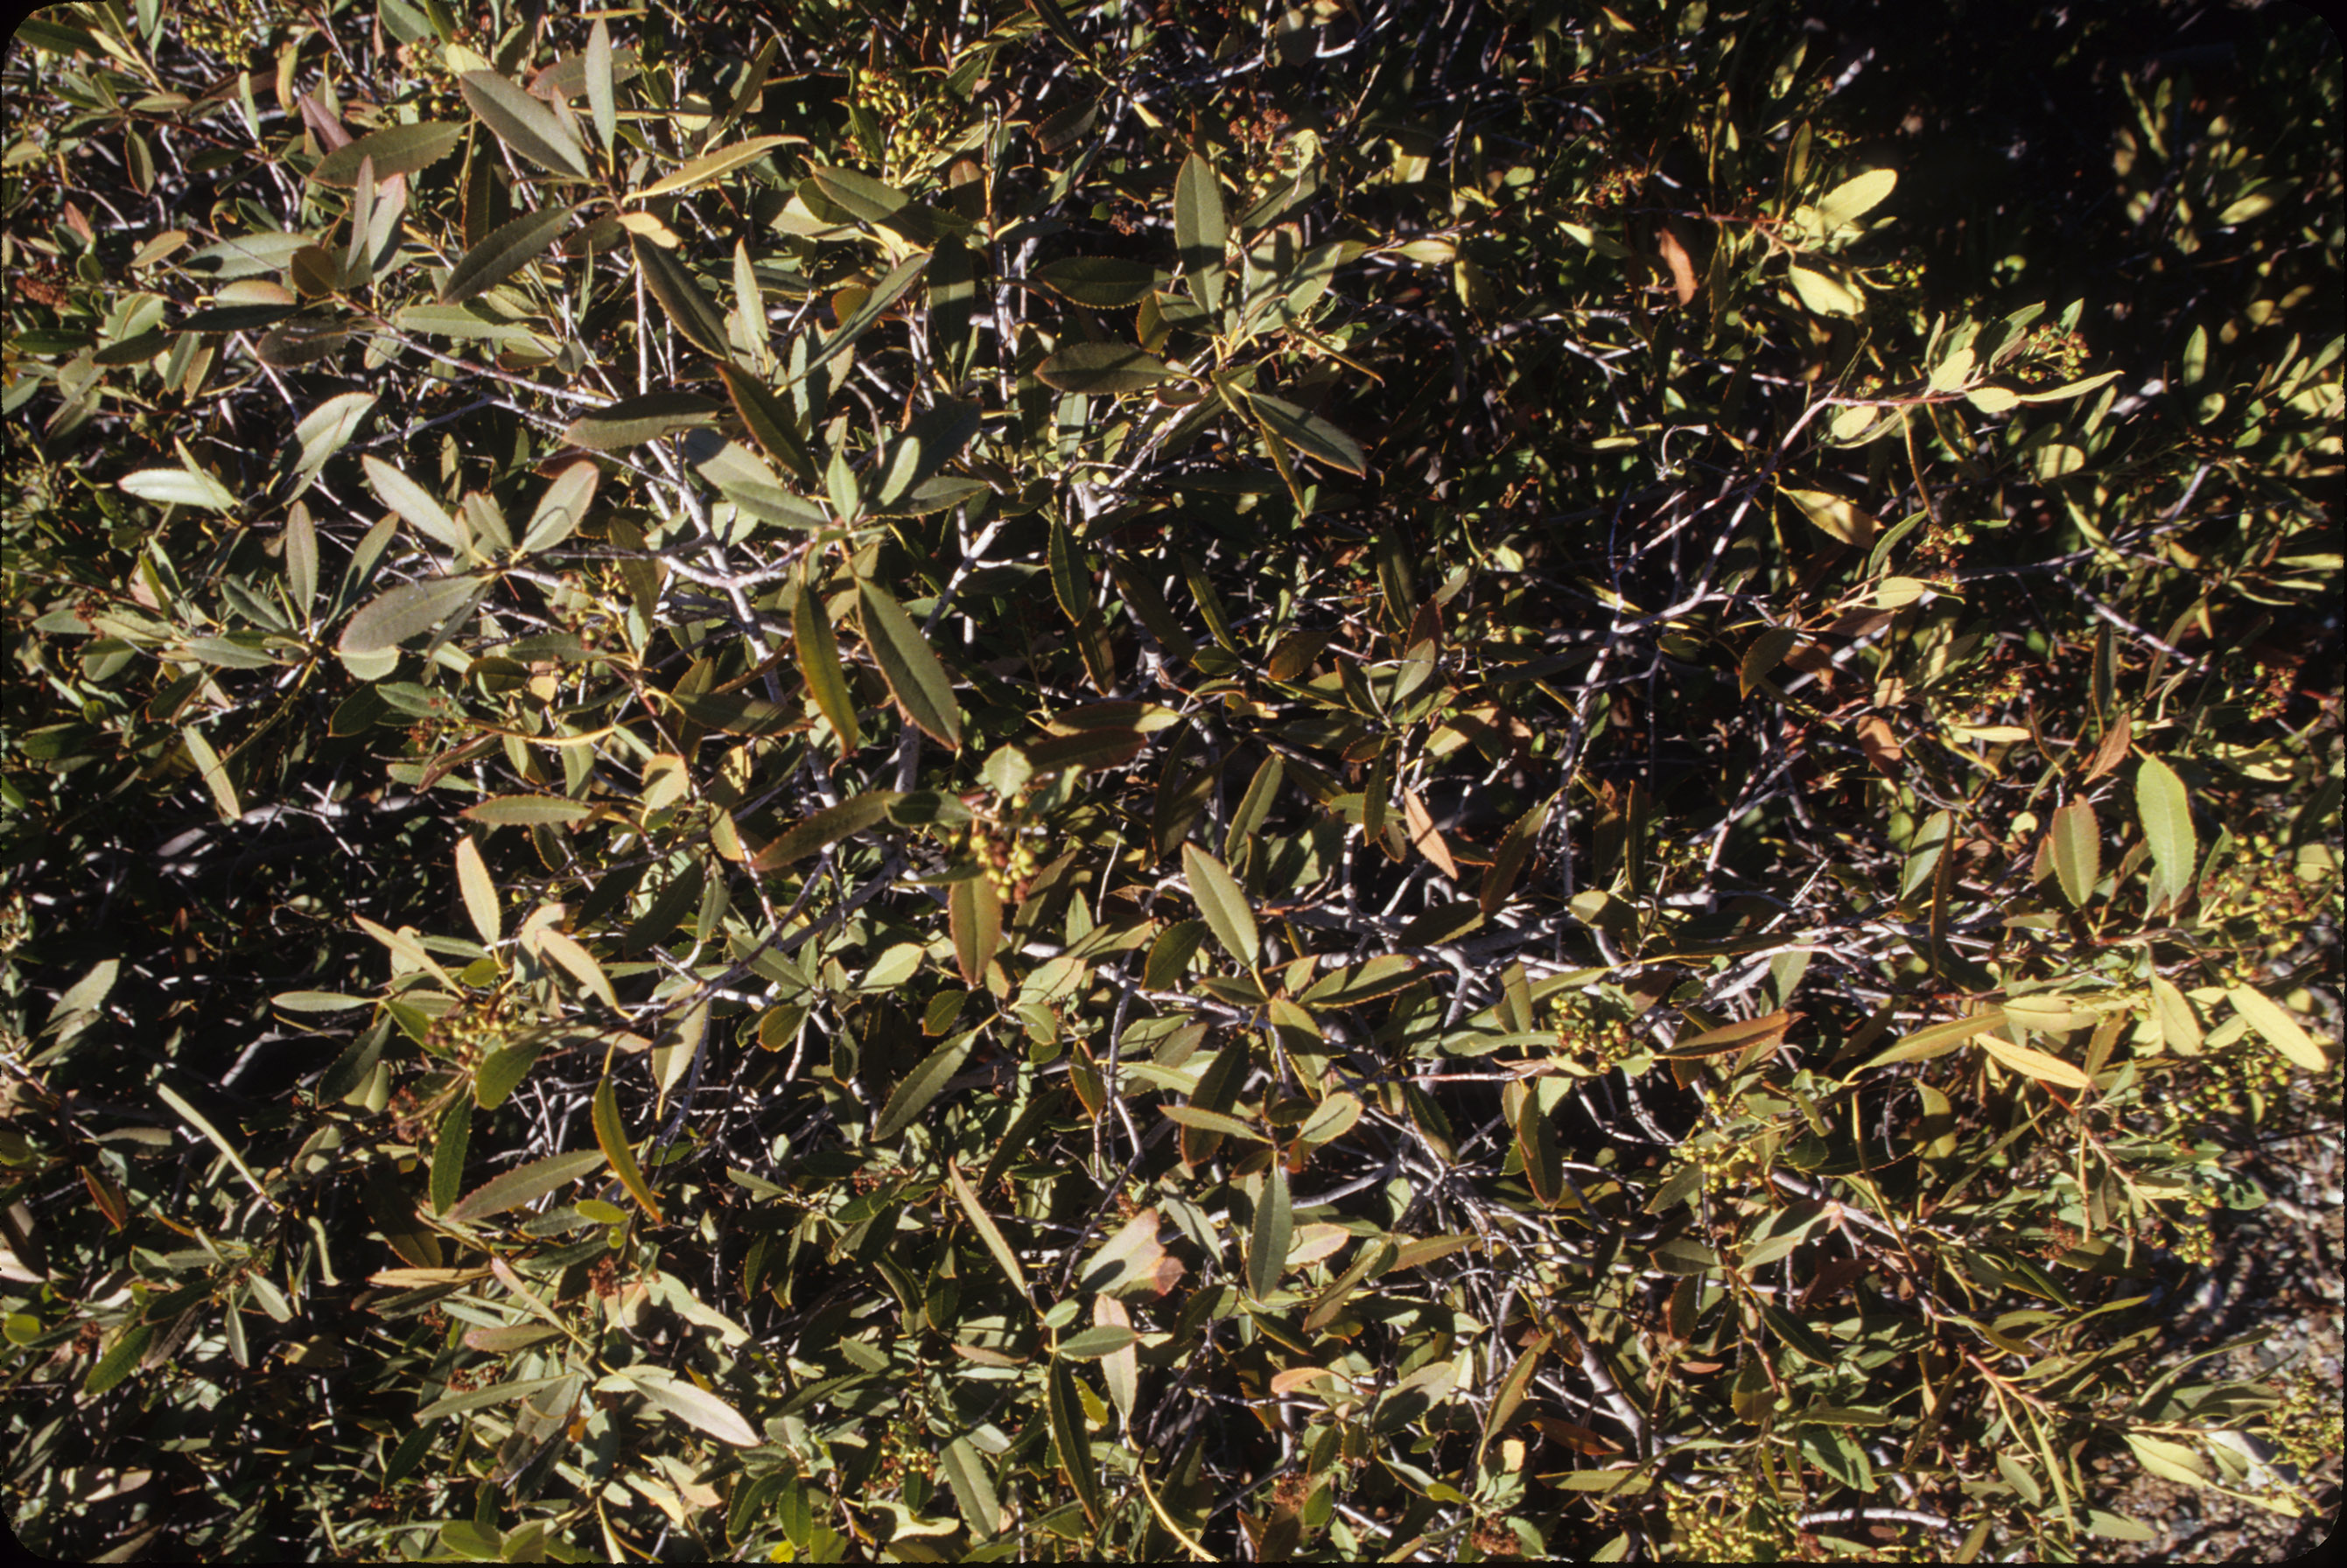
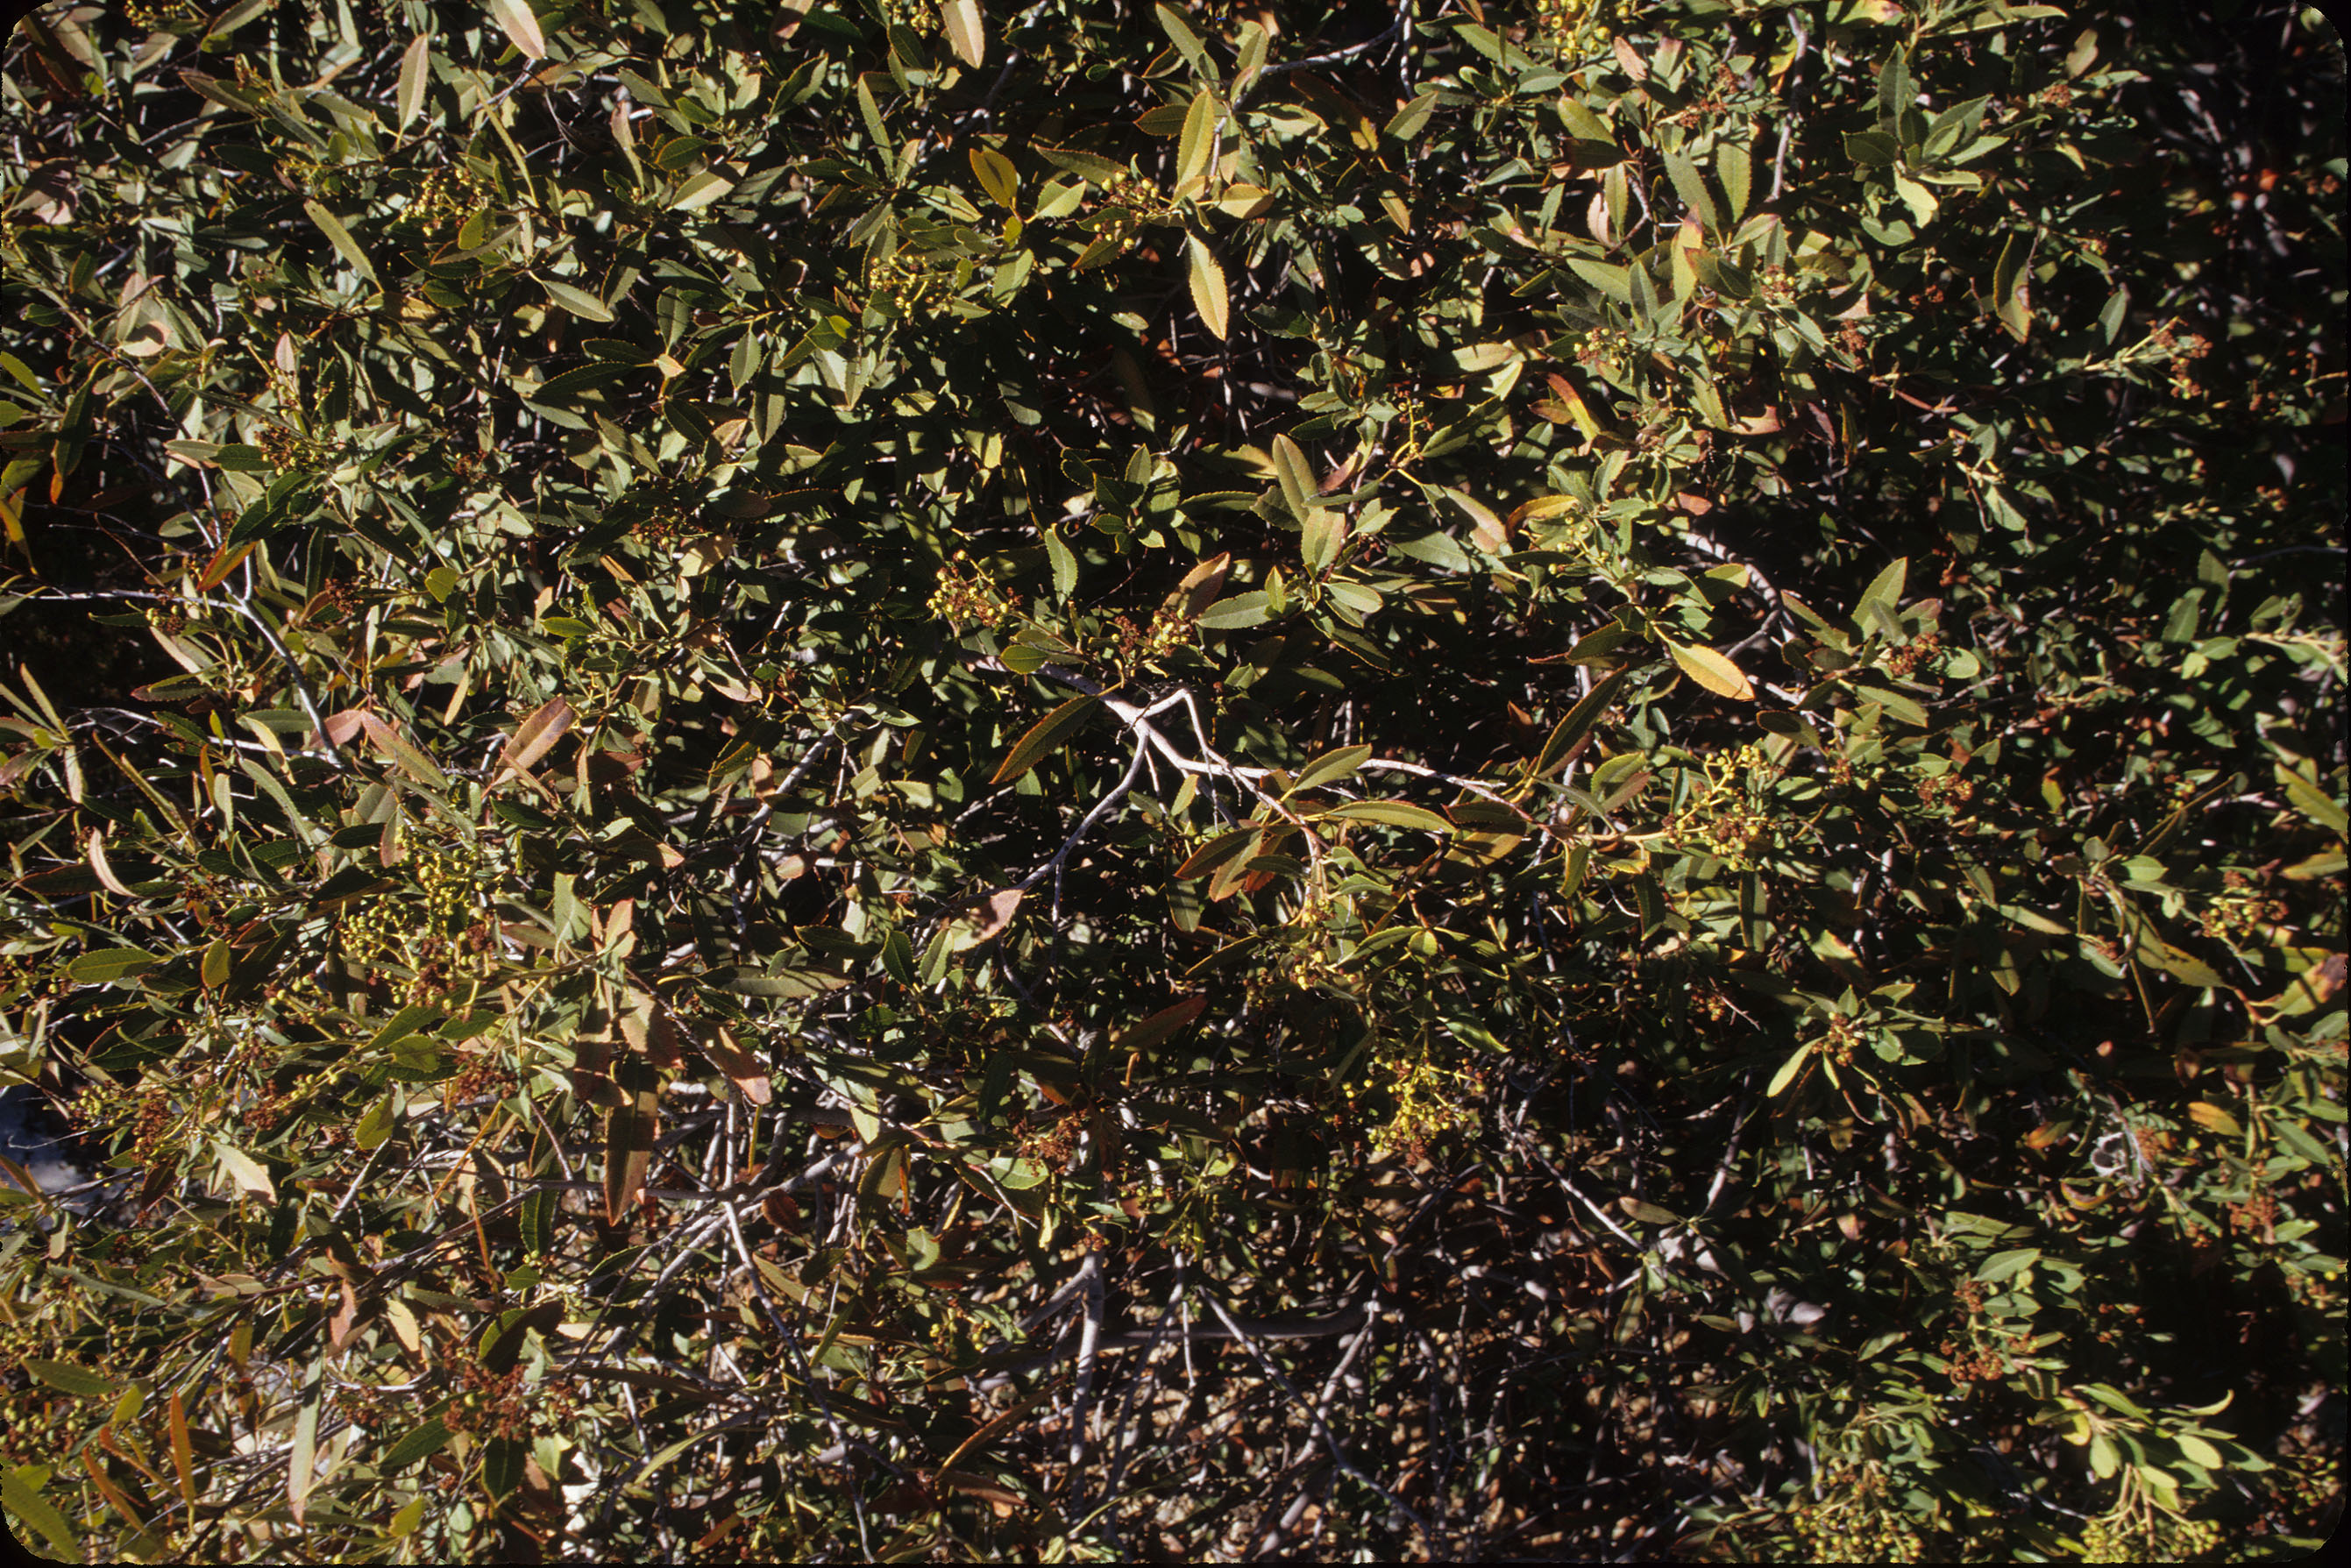
SAMPLE_DESCRIPTION:
This spectrum is the average reflectance of 29 field measurements of a toyon bush (Heteromeles arbutifolia). The measurements were made at 3:00 pm local time on September 3, 2001. These spectra were made using an ASD FullRange (653) in reflectance mode, relative to a Spectralon reference panel. The bare fiber of the spectrometer was used to measure the reflectance spectra of the bush. THe bush was 1.25 m in height and 2.5 m in diameter. The top surfaces of the leaves were primarily green with light green undersides. However some leaves were red/brown. THe tips of the stems were red. Near the base and middle of the bush the thicker stems/branches were light gray in color. Portions of the bush had green "berry-like" fruits at the tips of stems on the top of the bush. The tops of the leaves were dark green and waxy (with nearly white undersides). The stems were light yellow/brown in color. On average the field of view of the spectrometer included 20% green, waxy leaves, 20% yellow leaves, 20% old dry, brown leaves, 20% shadows, and 20% background soil/rock/litter. The fiber optic cable was pointed at nadir and held 30 cm above the top of the bush and moved around during the measurement while walking the perimeter of the bush. The instrument was programmed to record 6 second averages of reflectance (thus, each recorded spectrum was an average of 60 individual measurements). An average spectrum was computed from the recorded measurements and converted to absolute reflectance by multiplying by the reflectance spectrum of the Spectralon reference panel.
This spectrum was used in the following publication:
Swayze, G.A., Kokaly, R.F., Higgins, C.T., Clinkenbeard, J.P., Clark, R.N., Lowers, H.A, Sutley, and S.J., 2009,
Mapping potentially asbestos-bearing rocks using imaging spectroscopy, Geology Volume 37, pages 763-766.
http://dx.doi.org/10.1130/G30114A.1
IMAGE_OF_SAMPLE:
END_SAMPLE_DESCRIPTION.
COMPOSITIONAL_ANALYSIS_TYPE: None
COMPOSITION_DISCUSSION:
END_COMPOSITION_DISCUSSION.
TRACE_ELEMENT_ANALYSIS:
TRACE_ELEMENT_DISCUSSION:
END_TRACE_ELEMENT_DISCUSSION.
SPECTROSCOPIC_DISCUSSION:
END_SPECTROSCOPIC_DISCUSSION.
SPECTRAL_PURITY: 1a2_3_4_ # 1= 0.2-3, 2= 1.5-6, 3= 6-25, 4= 20-150 microns