
|
DOCUMENTATION_FORMAT: PLANT
SAMPLE_ID: Schoenoplectus americanus in CRMS121v38
PLANT_TYPE: Sedge, perennial grass
PLANT: Chairmaker's bulrush
LATIN_NAME: Schoenoplectus americanus (Pers.) Volk. ex Schinz & R. Keller
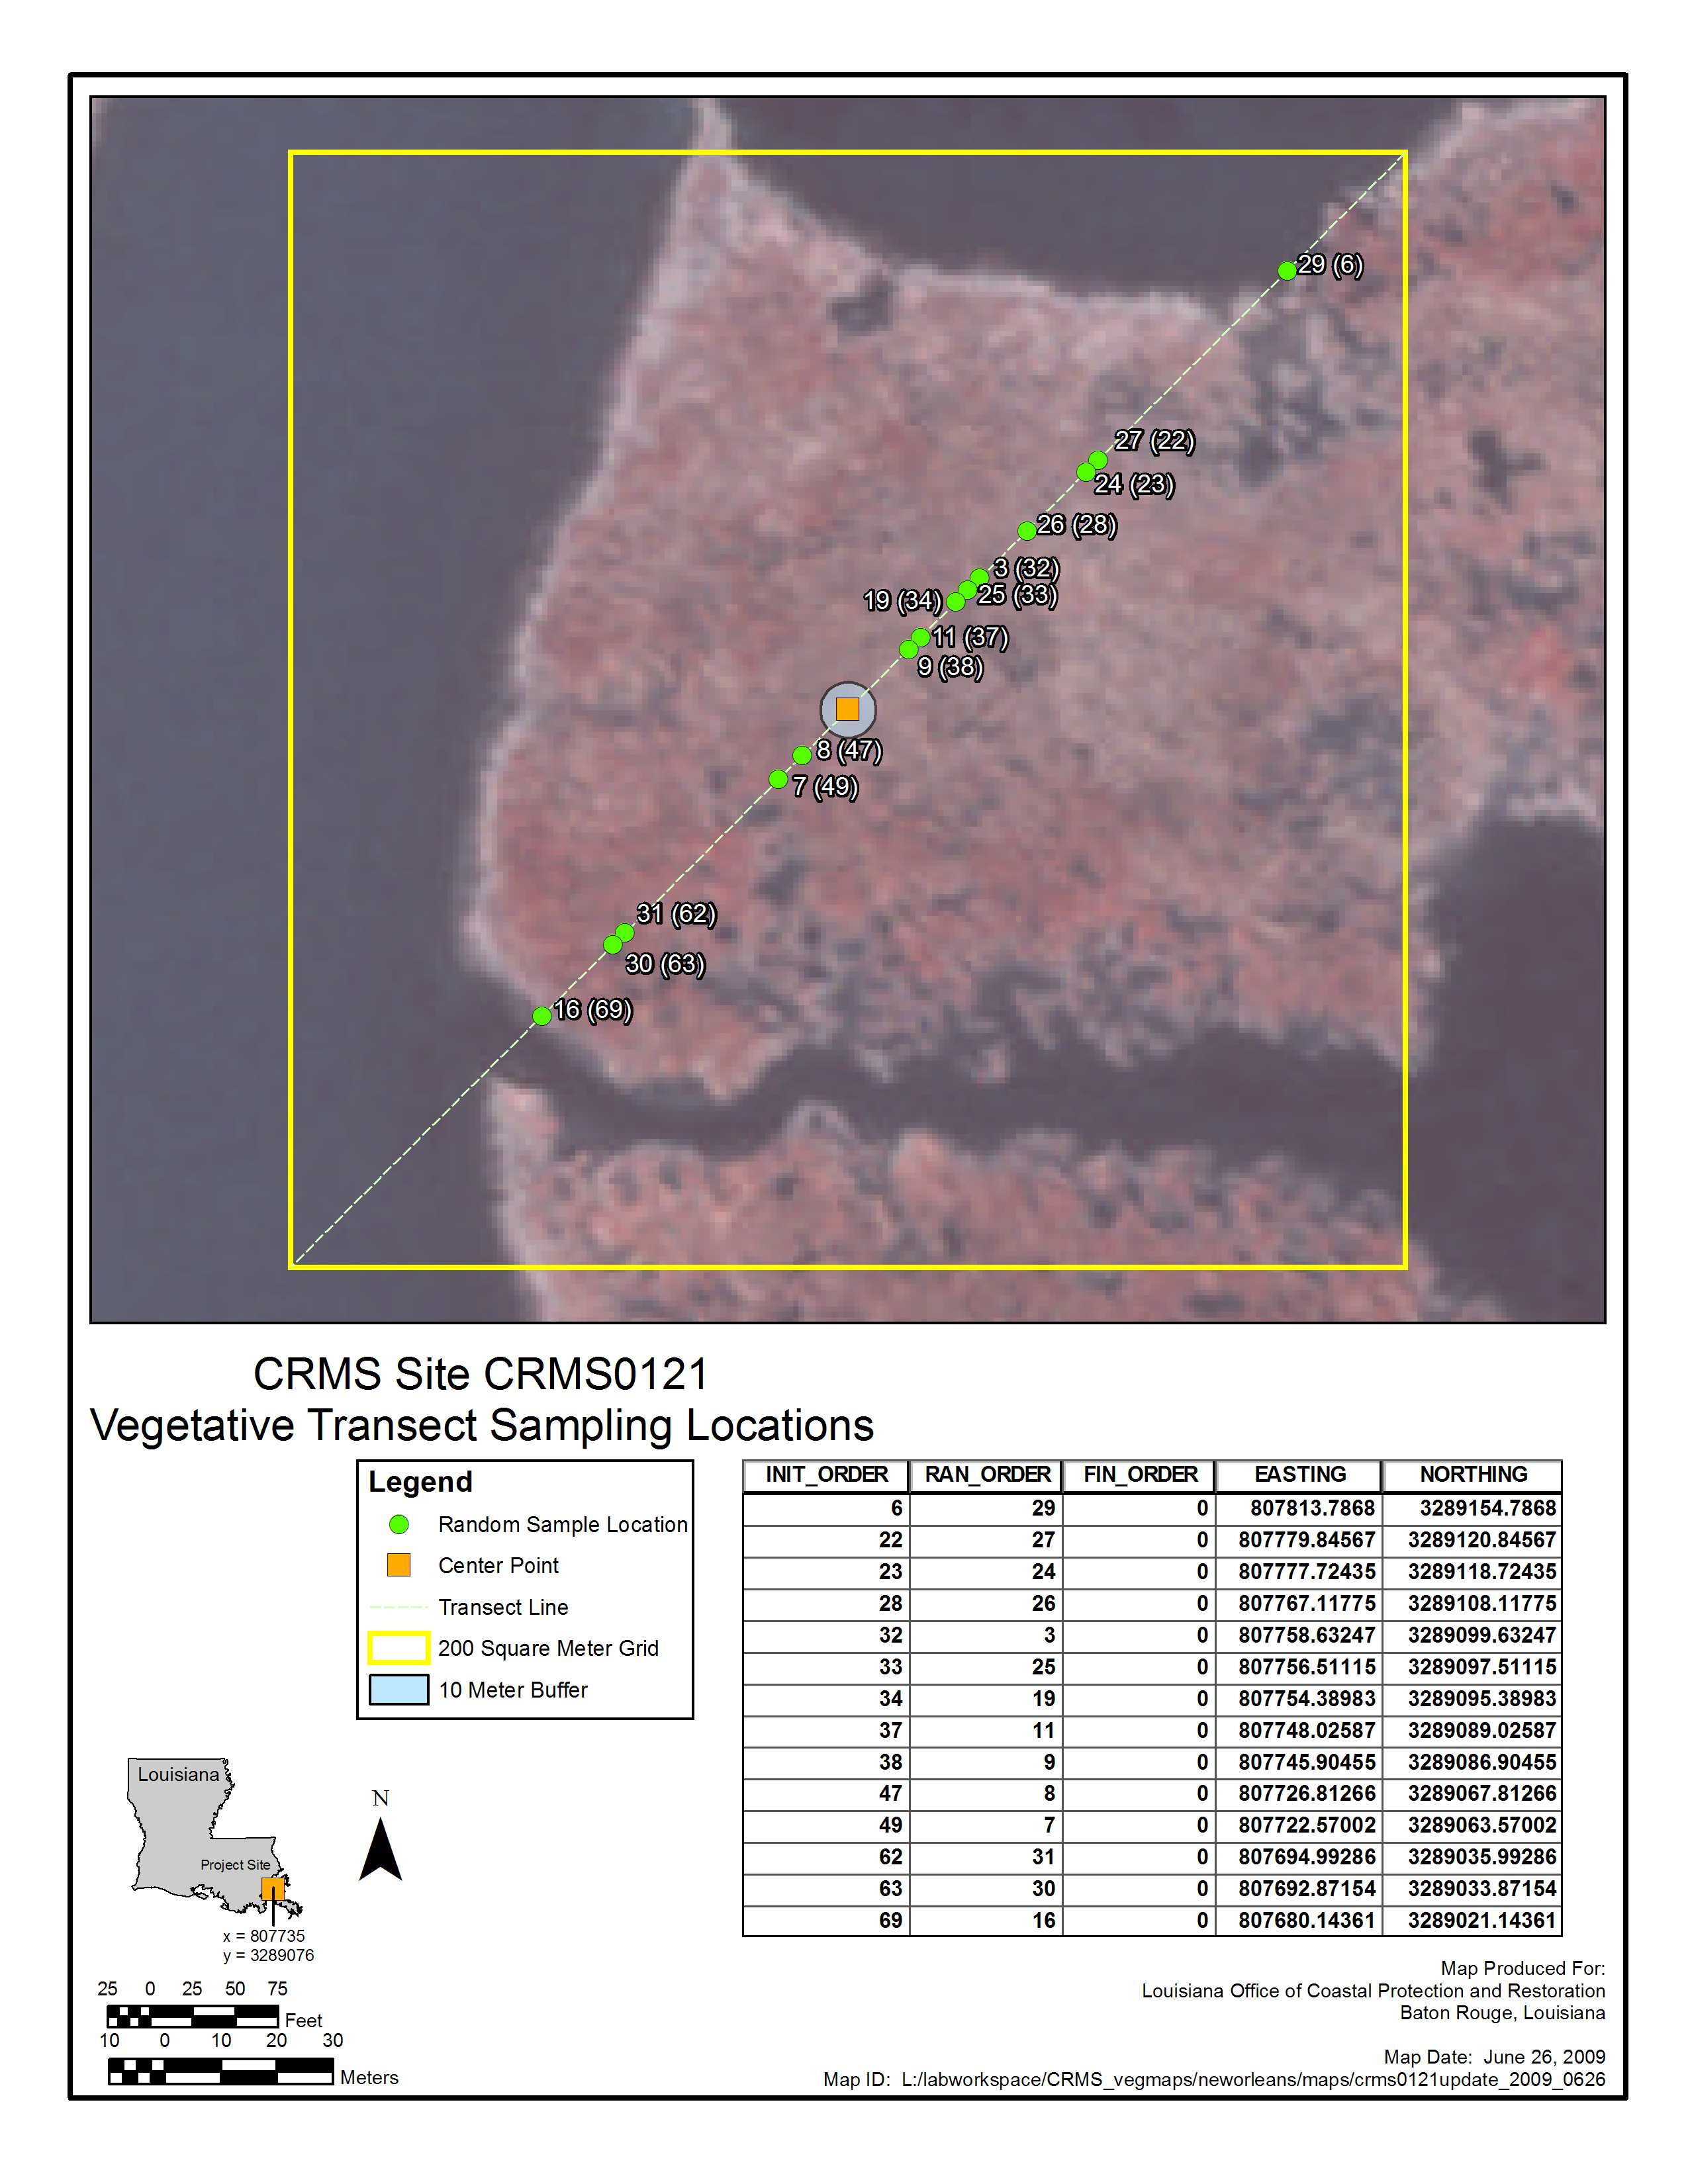
COLLECTION_LOCALITY: Coastwide Reference Monitoring System (CRMS) site 121 subplot v38. CRMS121 is located in southern Louisiana, approximately 37 kilometers southeast of New Orleans, Louisiana,in the western part of the Breton Sound hydrologic basin on the coast of the Gulf of Mexico.
COLLECTION_LATITUDE: 29.693770 deg. N
COLLECTION_LONGITUDE: 89.819752 deg. W
DATUM: NAD83
ORIGINAL_DONOR: Raymond F. Kokaly, USGS
SAMPLE_DESCRIPTION:
This spectrum is the average reflectance of 20 field measurements (using an artificial light source)
of yellow, chlorotic leaves and stems of chairmaker's bulrush (Schoenoplectus americanus).
The measurements were made on June 8, 2010.
These spectra were made using an ASD Field Spectrometer 3 (FS3) in reflectance mode, relative to a Spectralon reference panel.
The contact probe attachement (an artificial light source with a restricted, 1 cm diameter, field of view)
was used to measure the reflectance spectra of bundles of leaves and stems. Chlorotic stems and leaves of the canopy were bunched together.
The fiber optic was help approximately 5 cm from the bundle.
The instrument was programmed to record 6 second averages of reflectance (thus, each recorded spectrum was an average of 60 individual measurements).
An average spectrum was computed from the recorded measurements.
The average spectrum was converted to absolute reflectance by multiplying by the reflectance spectrum of the Spectralon reference panel.
The following channels were deleted from the spectrum (set to a value of -1.23e+34) because of atmospheric contamination or high levels of noise:
410-420, 768-796, 1002-1100, 1447-1622, 1651-1669, and 2077-2151 corresponding to wavelengths
0.759-0.769, 1.117-1.145, 1.351-1.449, 1.796-1.971, 2.000-2.018, and 2.426-2.500
Site Classification
The area has been predominantly classified as intermediate marsh (see http://lacoast.gov/crms2/home.aspx).
General Site Description
The plot is located in southern Louisiana, approximately 37 kilometers southeast of New Orleans, Louisiana.
It is in the western part of the Breton Sound hydrologic basin on the coast of the Gulf of Mexico.
For additional information on the CRMS site see http://lacoast.gov/crms2/home.aspx
Project Background
This site was measured as part of joint work between the USGS Denver Spectroscopy Laboratory and the
Coastal Restoration Assessment Branch of the USGS National Wetlands Research Center, Baton Rouge.
This spectrum was used in:
Kokaly, R.F., Couvillion, B.R., Holloway, J.M., Roberts, D.A., Ustin, S.L., Peterson, S.H., Khanna, S., and Piazza, S.C., 2013,
Spectroscopic remote sensing of the distribution and persistence of oil from the Deepwater Horizon spill in Barataria Bay marshes,
Remote Sensing of Environment, Volume 129, Pages 210-230. http://dx.doi.org/10.1016/j.rse.2012.10.028
IMAGE_OF_SAMPLE: in the site layout diagram, the subplot location is indicated by the matching number within the parentheses

END_SAMPLE_DESCRIPTION.
COMPOSITIONAL_ANALYSIS_TYPE: None
COMPOSITION_DISCUSSION:
END_COMPOSITION_DISCUSSION.
TRACE_ELEMENT_ANALYSIS:
TRACE_ELEMENT_DISCUSSION:
END_TRACE_ELEMENT_DISCUSSION.
SPECTROSCOPIC_DISCUSSION:
END_SPECTROSCOPIC_DISCUSSION.
SPECTRAL_PURITY: 1a2_3_4_ # 1= 0.2-3, 2= 1.5-6, 3= 6-25, 4= 20-150 microns