
|
DOCUMENTATION_FORMAT: PLANT
SAMPLE_ID: CRMS326v71 to v81
PLANT_TYPE: Mixed wetland species
PLANT: Chairmaker's bulrush, saltgrass, saltmeadow cordgrass, and sturdy bulrush
LATIN_NAME: Schoenoplectus americanus (Pers.) Volk. ex Schinz & R. Keller, Distichlis spicata (L.) Greene, Spartina patens (Ait.) Muhl., Schoenoplectus robustus (Pursh) M.T. Strong
COLLECTION_LOCALITY: Coastwide Reference Monitoring System (CRMS) site 326 subplot v71 to v81. CRMS326 is located in southern Louisiana, approximately 127 kilometers southwest of New Orleans, Louisiana, in the western part of the Terrebonne hydrologic basin on the coast of the Gulf of Mexico.
COLLECTION_LATITUDE: 29.273056 deg. N
COLLECTION_LONGITUDE: 91.073298 deg. W
DATUM: NAD83
ORIGINAL_DONOR: Raymond F. Kokaly, USGS
SAMPLE_DESCRIPTION:
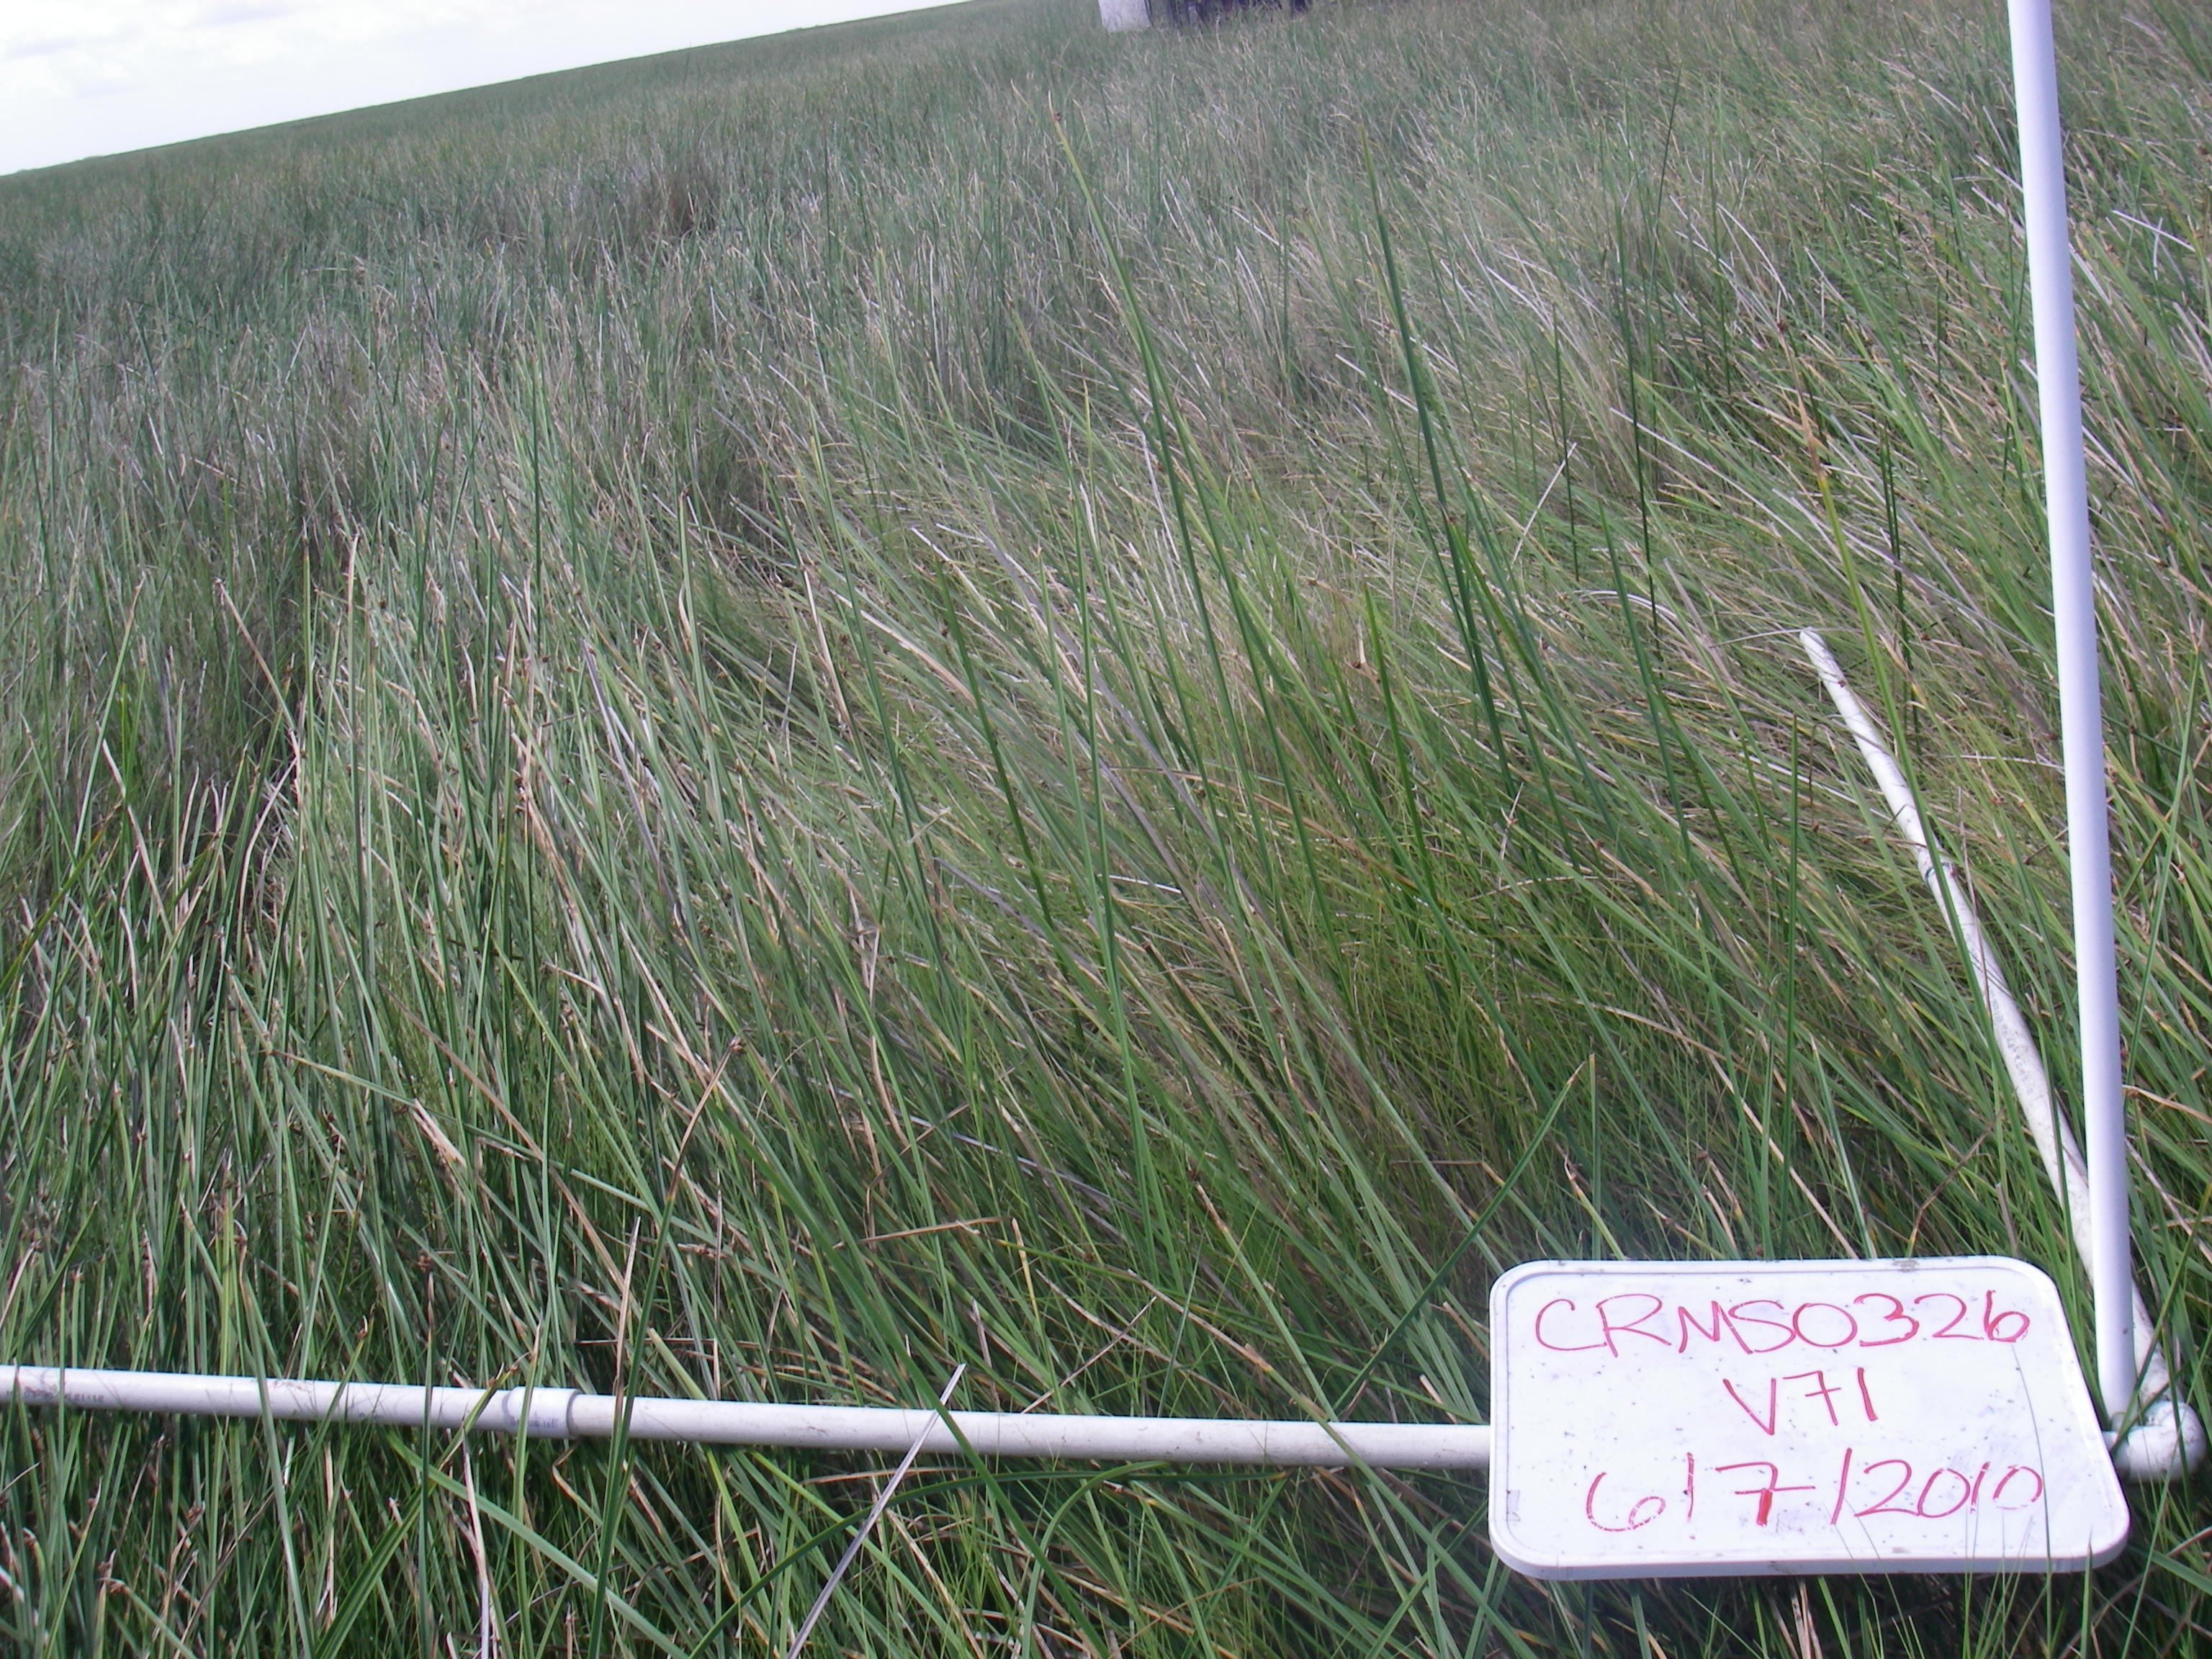
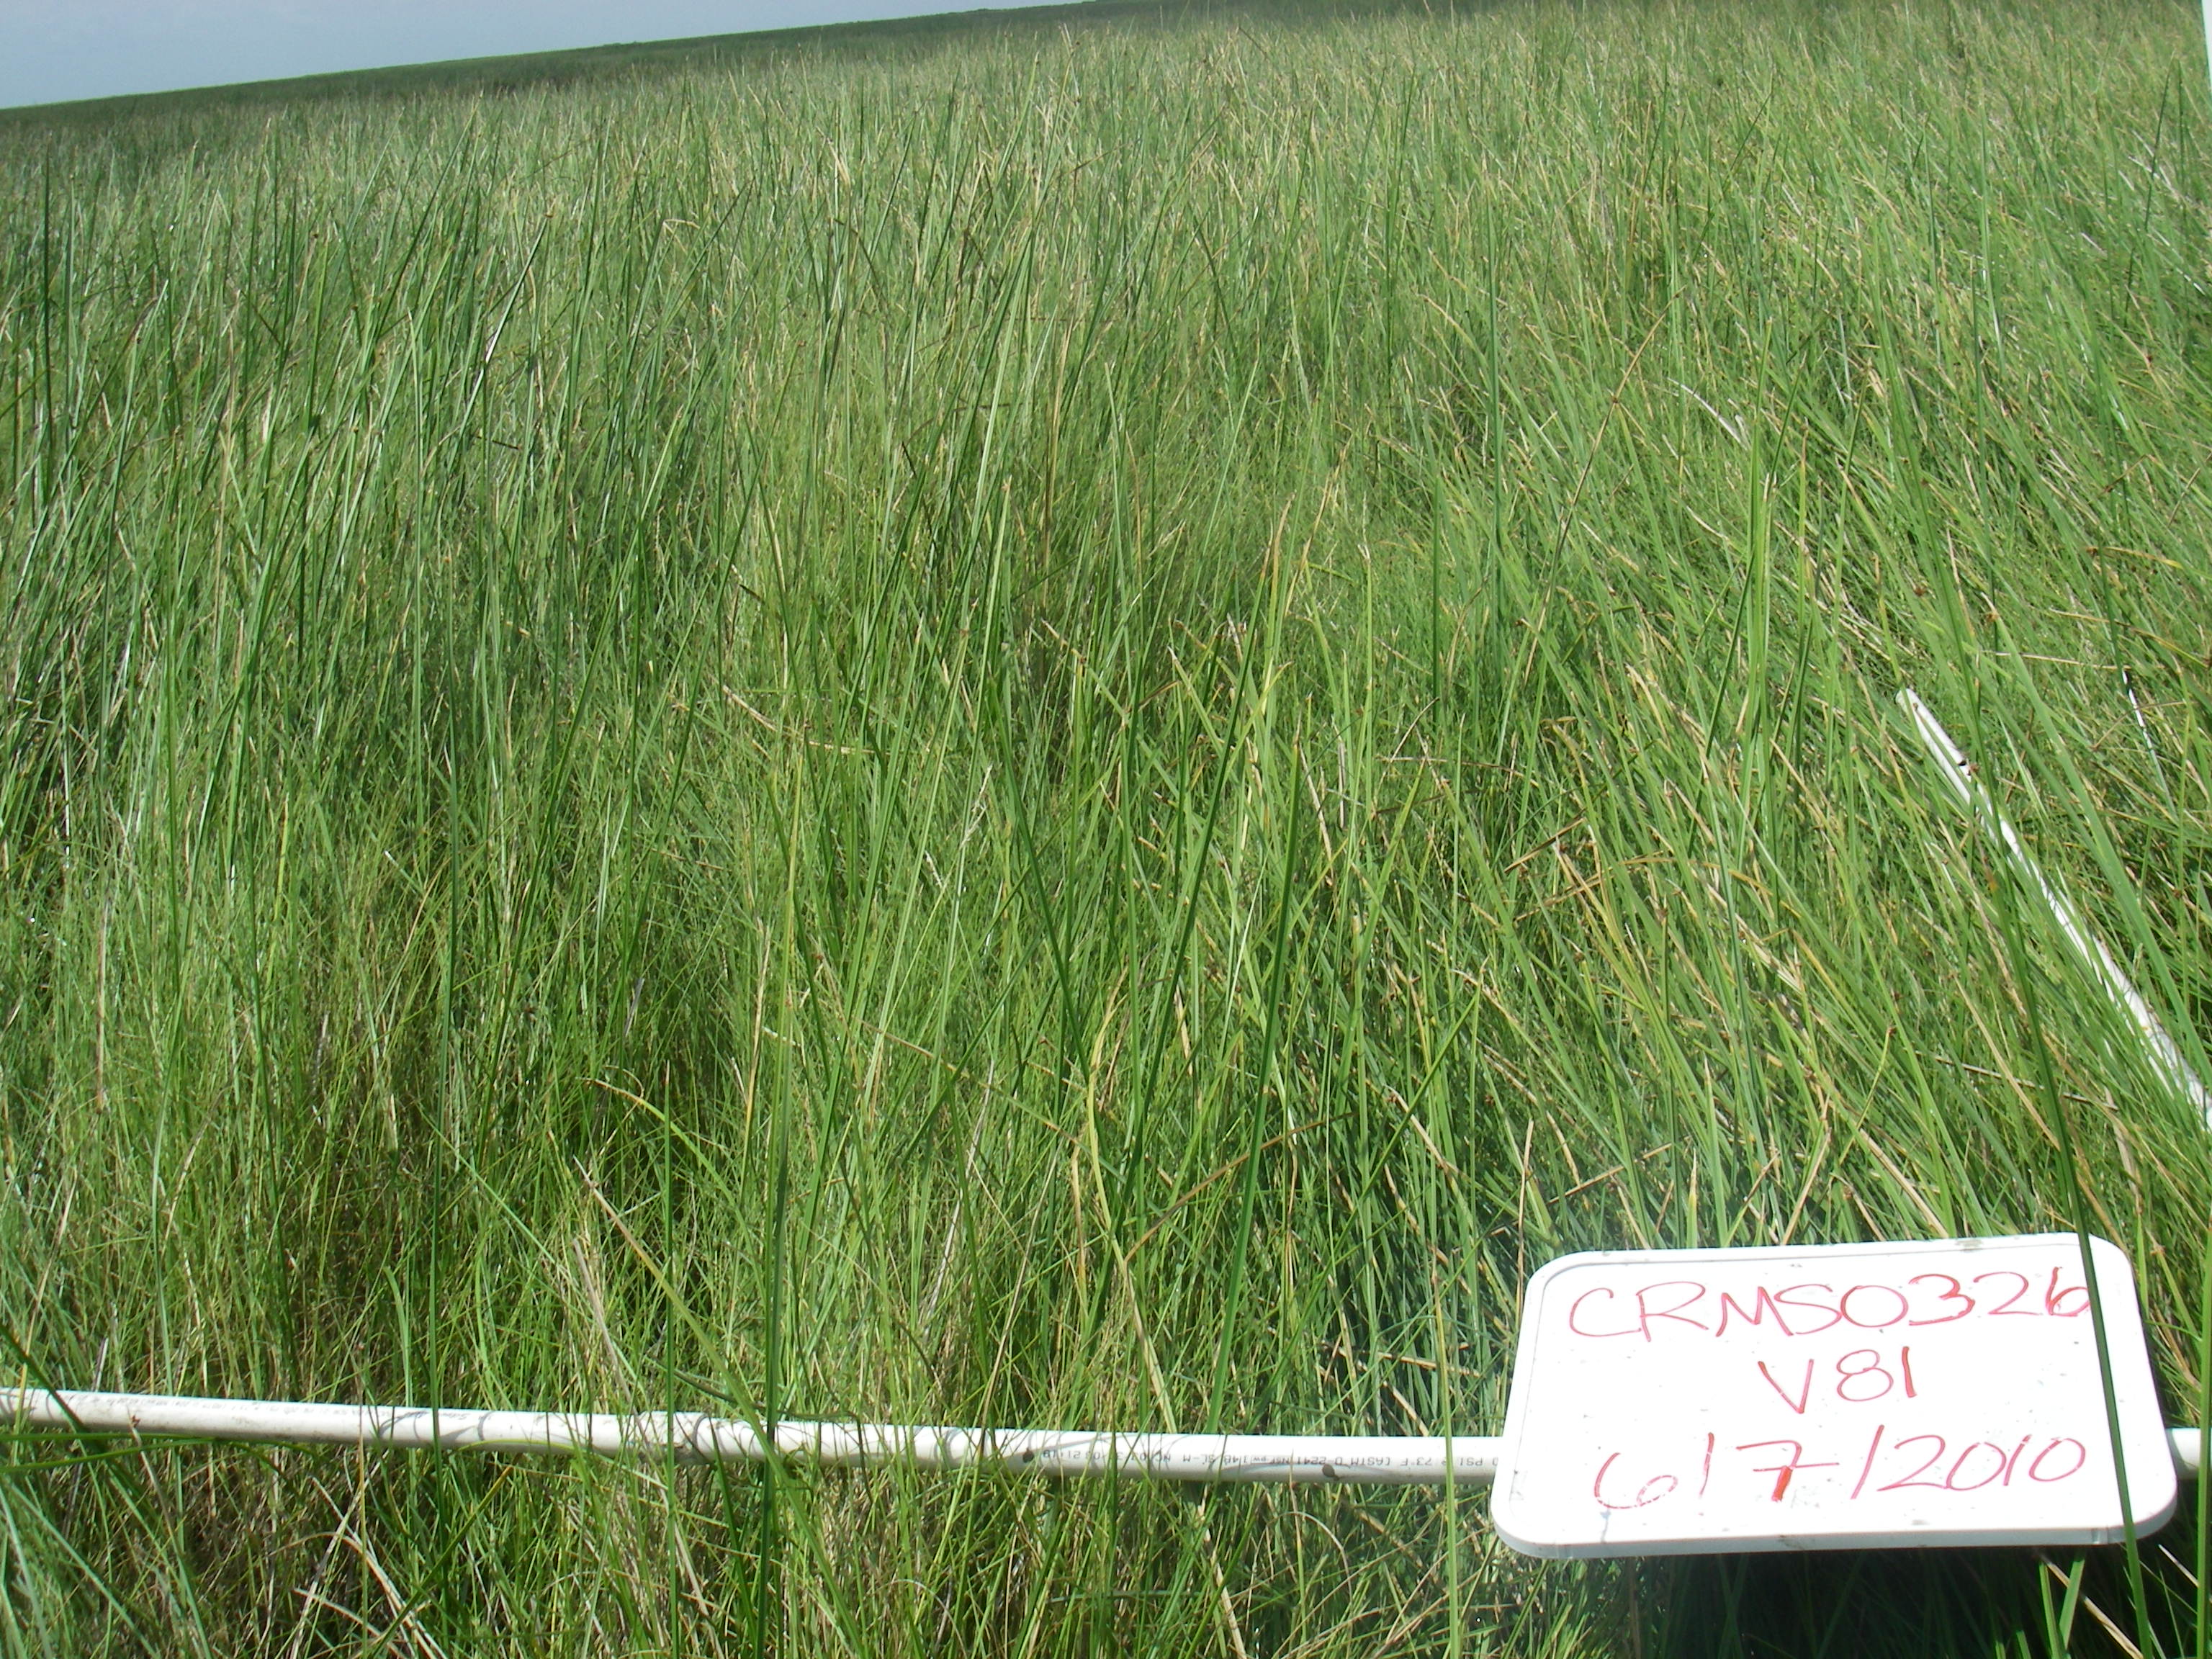
This spectrum is the average reflectance for a 10 m transect of marsh covered by mixed species. At both ends of the transect, vegetation species composition and cover were measured in 2x2 m plots. The average values from those plots are given in the site vegetation description.
Collection Date
07-Jun-2010
Site Vegetation Description
The vegetation cover was 100%. The average height of herbaceous vegetation was 87.5 cm. The following table shows the percent cover by cover class:
Cover Category, Sub-Category                Cover (%)
_____________________________      ____________________________
Vegetation, Total Cover                 100
 Vegetation, Tree                            0
 Vegetation, Shrub                           0
 Vegetation, Grass                         100
 Vegetation, Forb                            0
Non-vegetation, Total Cover               0
 Non-vegetation, Litter                      0
 Non-vegetation, Bare                        0
 Non-vegetation, Water                       0
 Non-vegetation, Other                       0
_____________________________      ____________________________
The following table shows the cover by shrub species in the plot:
Shrub Species                            Cover (%)
_____________________________________  ____________
none
_____________________________________  ____________
The following table shows the cover by grass species in the plot:
Grass Species                             Cover (%)
_____________________________________  _____________
Schoenoplectus americanus                   47
Distichlis spicata                          41
Spartina patens                             21
Schoenoplectus robustus                    0.5
_____________________________________  _____________
The following table shows the cover by forb species in the plot:
Forb Species                             Cover (%)
_____________________________________  _____________
none
_____________________________________  _____________
Field Observations
At the start of the transect: water Level is 0.03 ft above marsh. At the end of the transect: no water on marsh, just damp sediment.
Site Classification
The area has been predominantly classified as brackish marsh (see http://lacoast.gov/crms2/home.aspx).
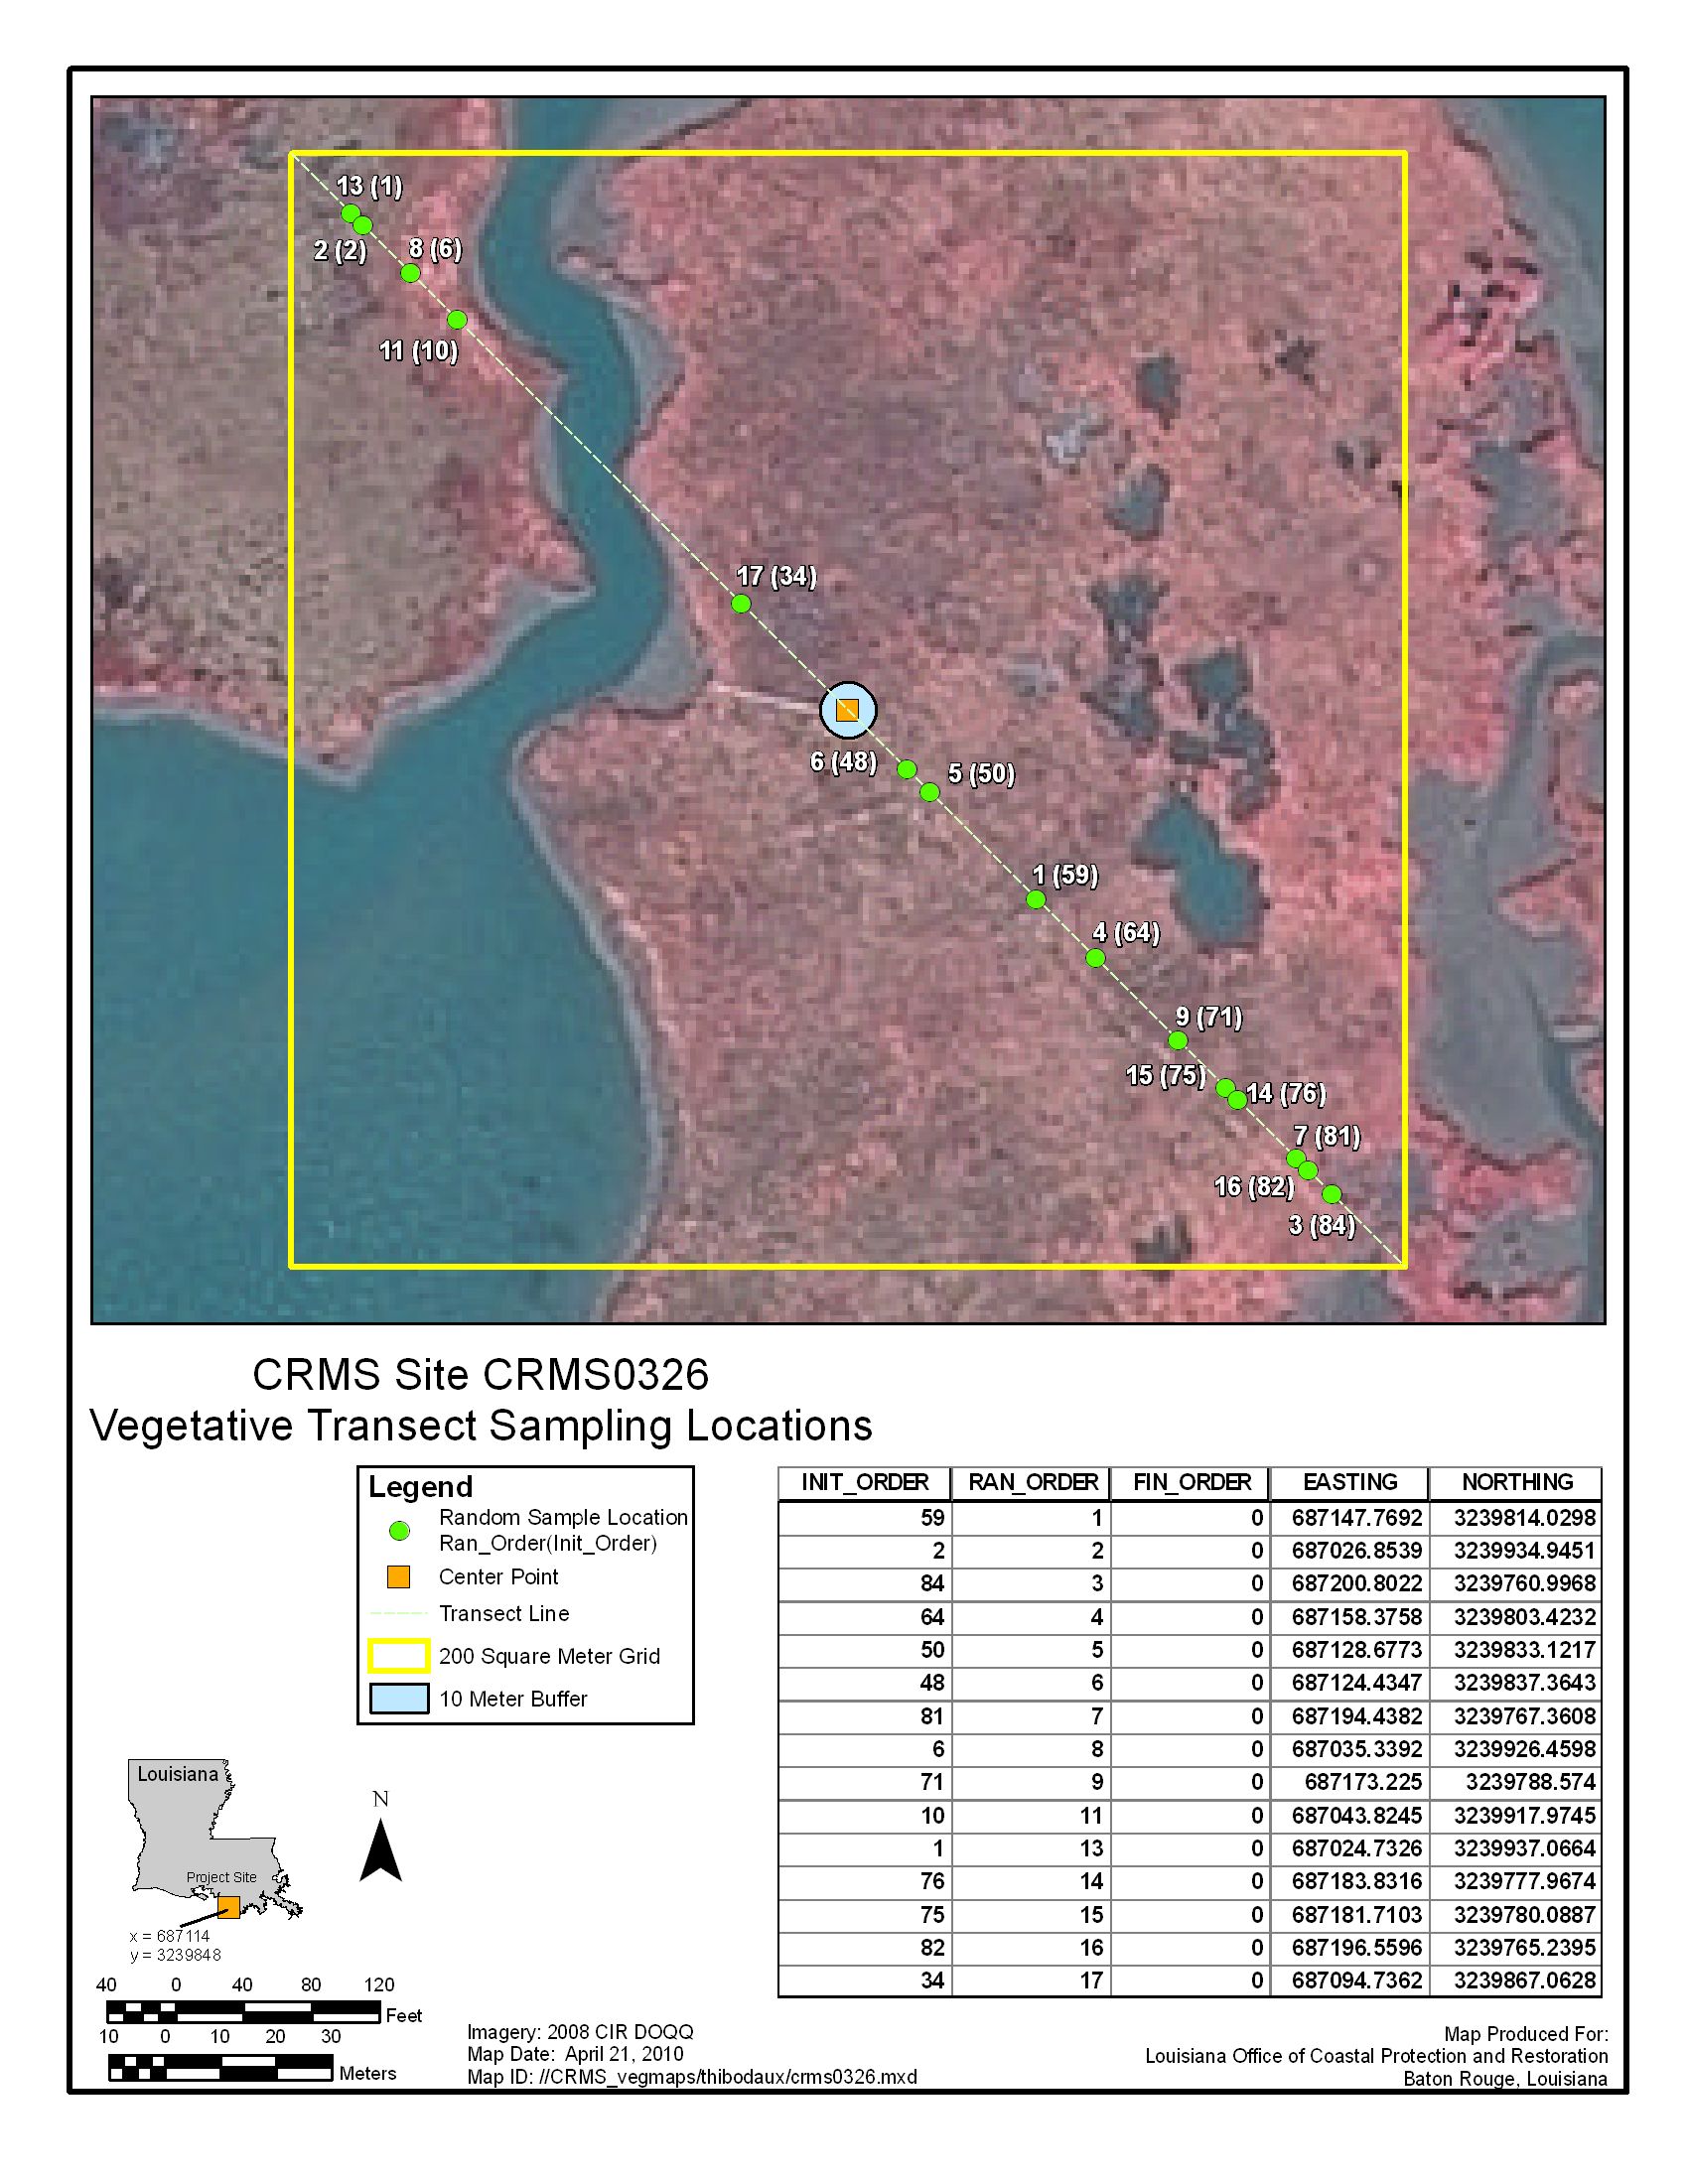
Plot Location, Dimensions, and Vegetation Sampling
The coordinates of the start and stop of the transect are 29.273154 N, 91.073405 W and 29.272959 N, 91.073190 W respectively (in decimal degrees, datum is NAD83).
Within the plots at either end of the transect, vegetation species were identified and the percent cover of each species was visually estimated.
Spectral Measurement and Processing Methods
This spectrum is the average of 10 spectral measurements recorded along the transect.
These spectra were collected using an ASD Field Spectrometer 3 (FS3) in reflectance mode, relative to a Spectralon reference panel.
While walking on the edges of the plot, the fiber optic cable was pointed at nadir (straight down) at approximately shoulder height.
The instrument was programmed to record 6 second averages of reflectance (thus, each recorded spectrum was an average of 60 individual measurements).
The average spectrum was converted to absolute reflectance by multiplying by the reflectance spectrum of the Spectralon reference panel.
The following channels were deleted from the spectrum (set to a value of -1.23e+34) because of atmospheric contamination or high levels of noise:
410-420, 768-796, 1002-1100, 1447-1622, 1651-1669, and 2077-2151 corresponding to wavelengths
0.759-0.769, 1.117-1.145, 1.351-1.449, 1.796-1.971, 2.000-2.018, and 2.426-2.500
General Site Description
The transect is located in southern Louisiana, approximately 127 kilometers southwest of New Orleans, Louisiana.
It is in the western part of the Terrebonne hydrologic basin on the coast of the Gulf of Mexico.
For additional information on the CRMS site see http://lacoast.gov/crms2/home.aspx
Project Background
This site was measured as part of joint work between the USGS Denver Spectroscopy Laboratory and the
Coastal Restoration Assessment Branch of the USGS National Wetlands Research Center, Baton Rouge.
This spectrum was used in the following publication:
Kokaly, R.F., Couvillion, B.R., Holloway, J.M., Roberts, D.A., Ustin, S.L., Peterson, S.H., Khanna, S., and Piazza, S.C., 2013,
Spectroscopic remote sensing of the distribution and persistence of oil from the Deepwater Horizon spill in Barataria Bay marshes,
Remote Sensing of Environment, Volume 129, Pages 210-230. http://dx.doi.org/10.1016/j.rse.2012.10.028
IMAGE_OF_SAMPLE: in the site layout diagram, the subplot locations at the ends of the transect are indicated by the matching numbers within the parentheses
END_SAMPLE_DESCRIPTION.
COMPOSITIONAL_ANALYSIS_TYPE: None
COMPOSITION_DISCUSSION:
END_COMPOSITION_DISCUSSION.
TRACE_ELEMENT_ANALYSIS:
TRACE_ELEMENT_DISCUSSION:
END_TRACE_ELEMENT_DISCUSSION.
SPECTROSCOPIC_DISCUSSION:
END_SPECTROSCOPIC_DISCUSSION.
SPECTRAL_PURITY: 1a2_3_4_ # 1= 0.2-3, 2= 1.5-6, 3= 6-25, 4= 20-150 microns