
|
DOCUMENTATION_FORMAT: MINERAL
SAMPLE_ID: GDS99
MINERAL_TYPE: Sulfate
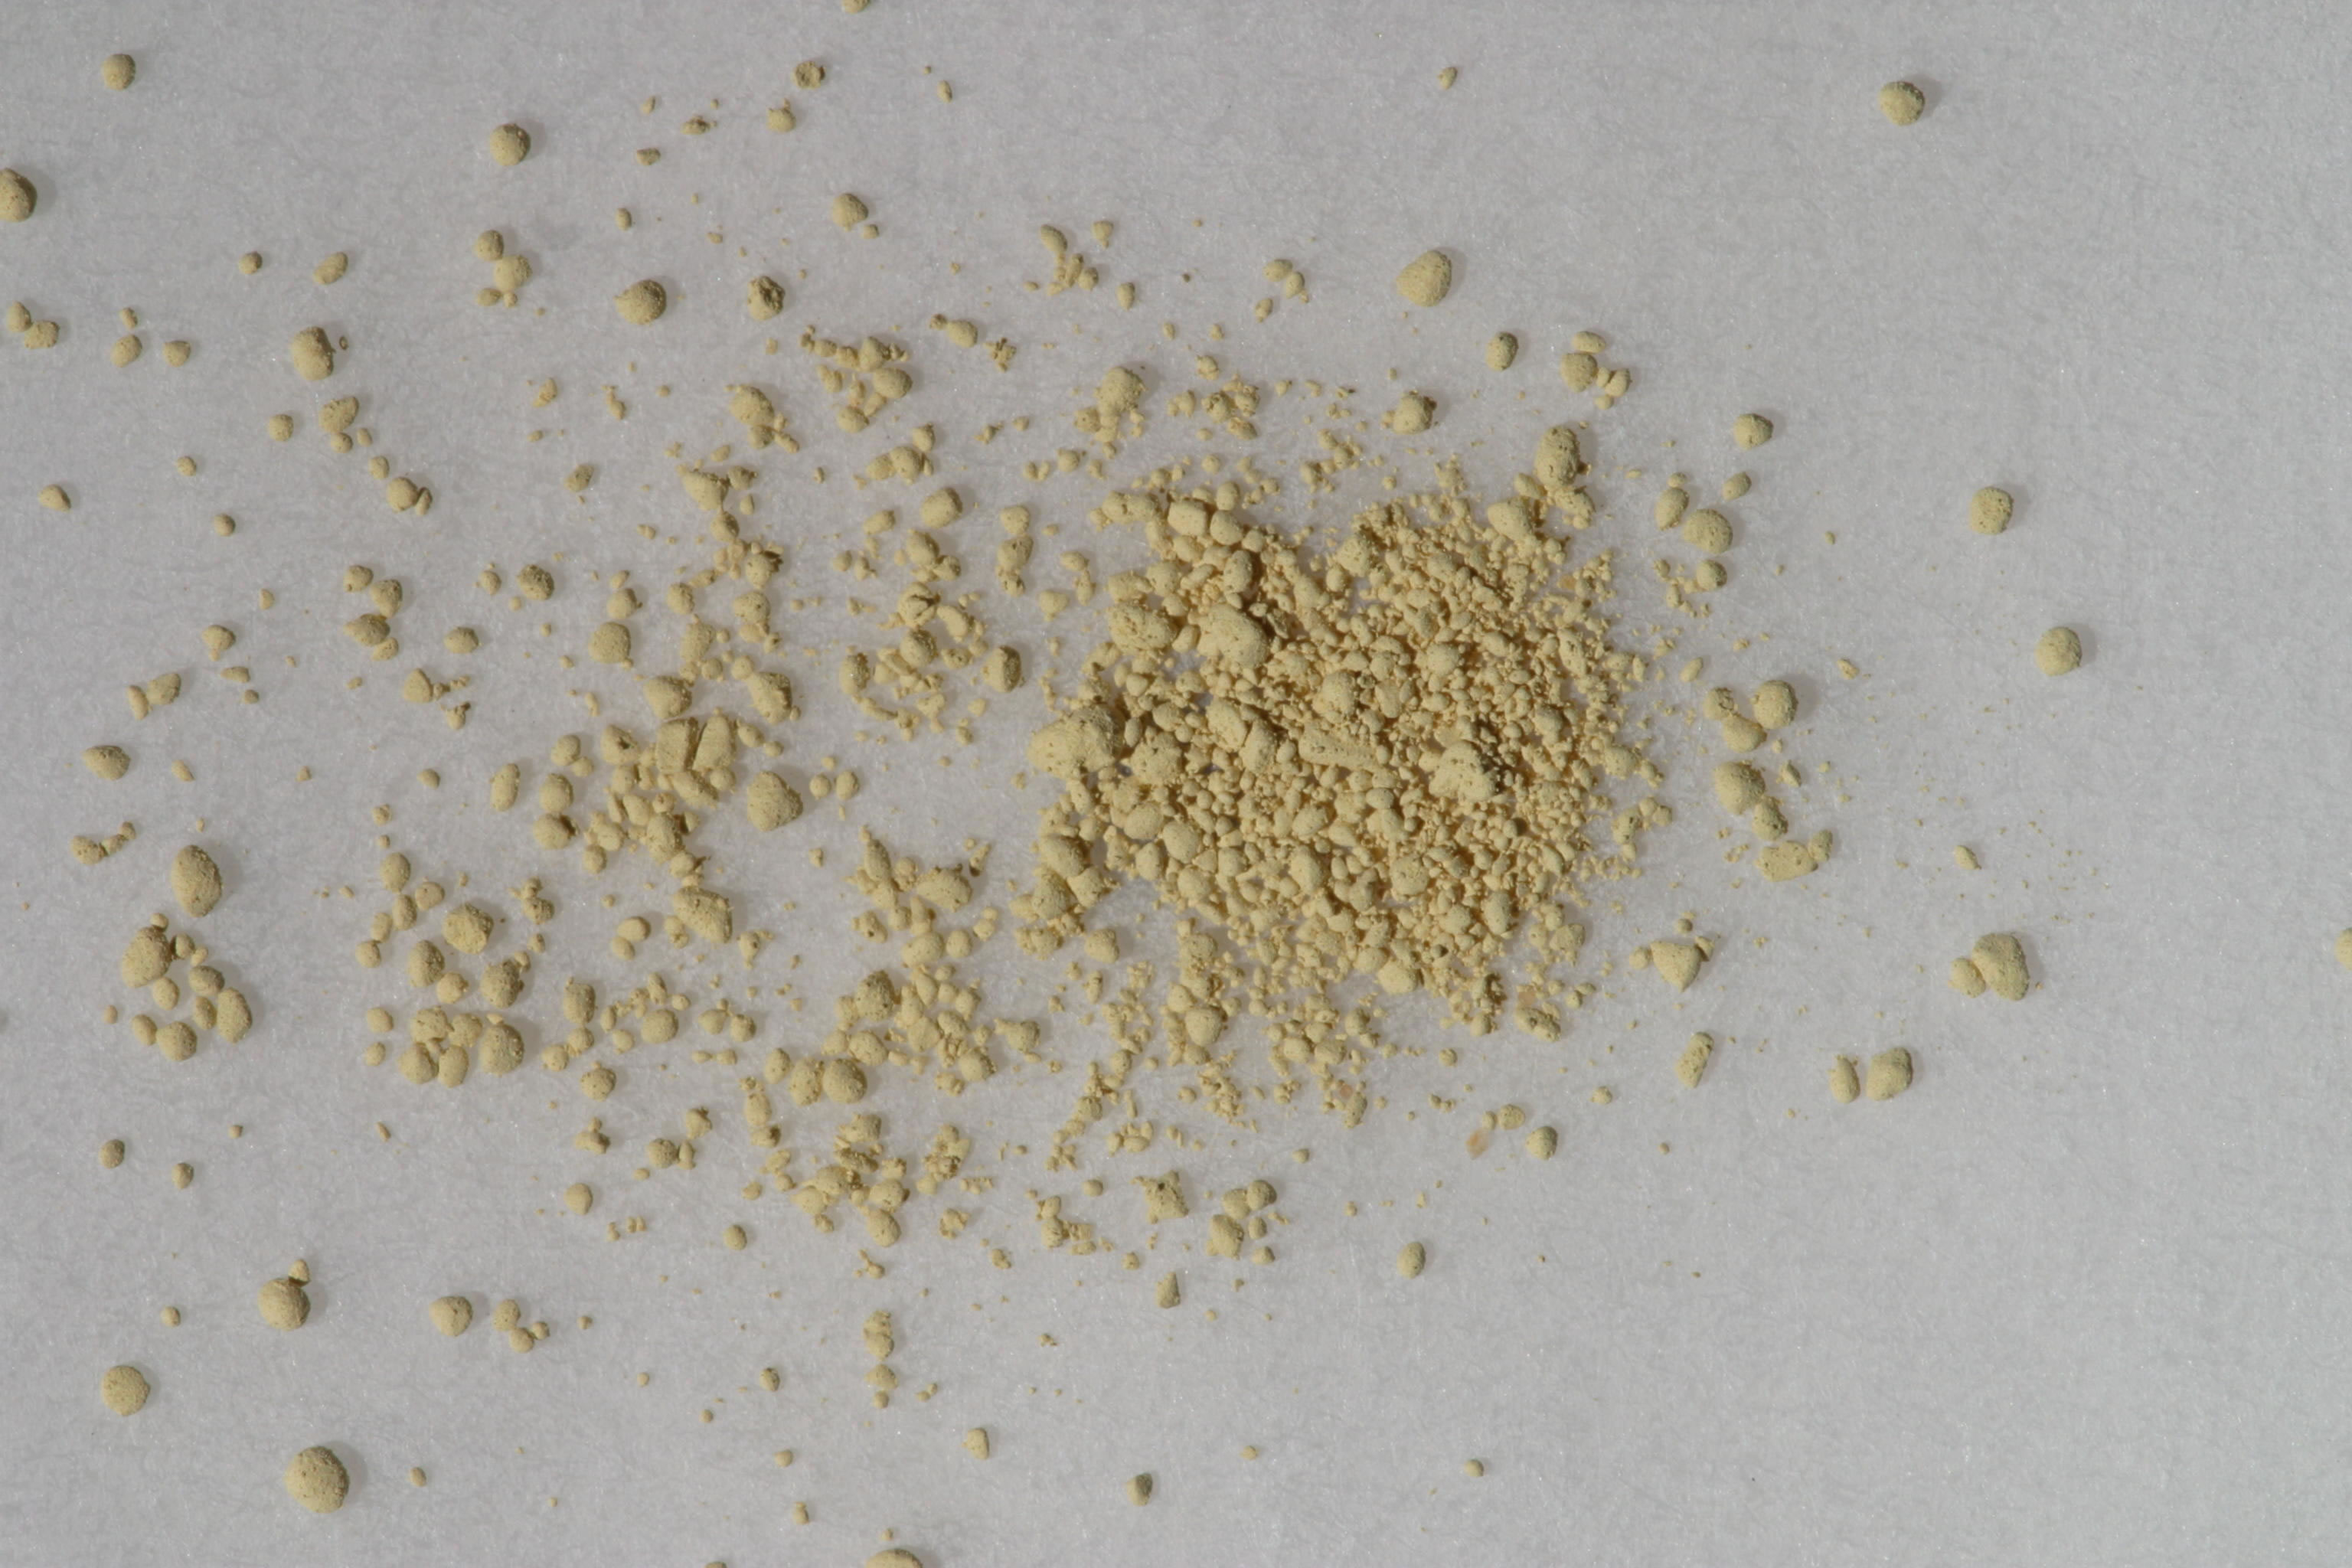
MINERAL: Jarosite (K-jarosite) (Synthetic) (Alunite group)
FORMULA: K(Fe+3)3(SO4)2(OH)6
FORMULA_HTML: KFe+33(SO4)2(OH)6
COLLECTION_LOCALITY: Synthetic
ORIGINAL_DONOR: Roger Stroffregen, SMU
CURRENT_SAMPLE_LOCATION: USGS Denver Spectroscopy Laboratory
ULTIMATE_SAMPLE_LOCATION: USGS Denver Spectroscopy Laboratory
SAMPLE_DESCRIPTION:
Sample synthesized at 200C
IMAGE_OF_SAMPLE:
END_SAMPLE_DESCRIPTION.
XRD_ANALYSIS:
40 kV - 30 mA, 7.3-6.5 keV
Reference: JCPDS #22-827 (jarosite)
Found: Jarosite
Comment: Sharp patterns (GDS99 is exceptional) indicate good
crystallinity and compositional homogeneity. All
reflections are accounted for by the JCPDS card.
However, the samples are not identical. GDS98 has
cell hexagonal dimensions a = 7.313(1) and c = 17.060(4)
Angstroms whereas GDS99 has a = 7.302(1) and c = 17.214(2)
Angstroms. The difference in c is significant and suggests
a composition difference between the two samples. Are
there differences in the optical spectra?"
J.S. Huebner, J. Pickrell, and J. Randow, 1993, written communication.
END_XRD_ANALYSIS.
COMPOSITIONAL_ANALYSIS_TYPE: None # XRF, EPMA, ICP(Trace), WChem
COMPOSITION_TRACE:
COMPOSITION_DISCUSSION:
END_COMPOSITION_DISCUSSION.
MICROSCOPIC_EXAMINATION:
END_MICROSCOPIC_EXAMINATION.
SPECTROSCOPIC_DISCUSSION:
END_SPECTROSCOPIC_DISCUSSION.
SPECTRAL_PURITY: 1a2a3a4_ # 1= 0.2-3, 2= 1.5-6, 3= 6-25, 4= 20-150 microns