
|
DOCUMENTATION_FORMAT: PLANT
SAMPLE_ID: CA01-PISA-1
PLANT_TYPE: Pine tree, Coniferous evergreen
PLANT: Gray Pine, also known as California foothill pine
LATIN_NAME: Pinus sabiniana Douglas ex Douglas
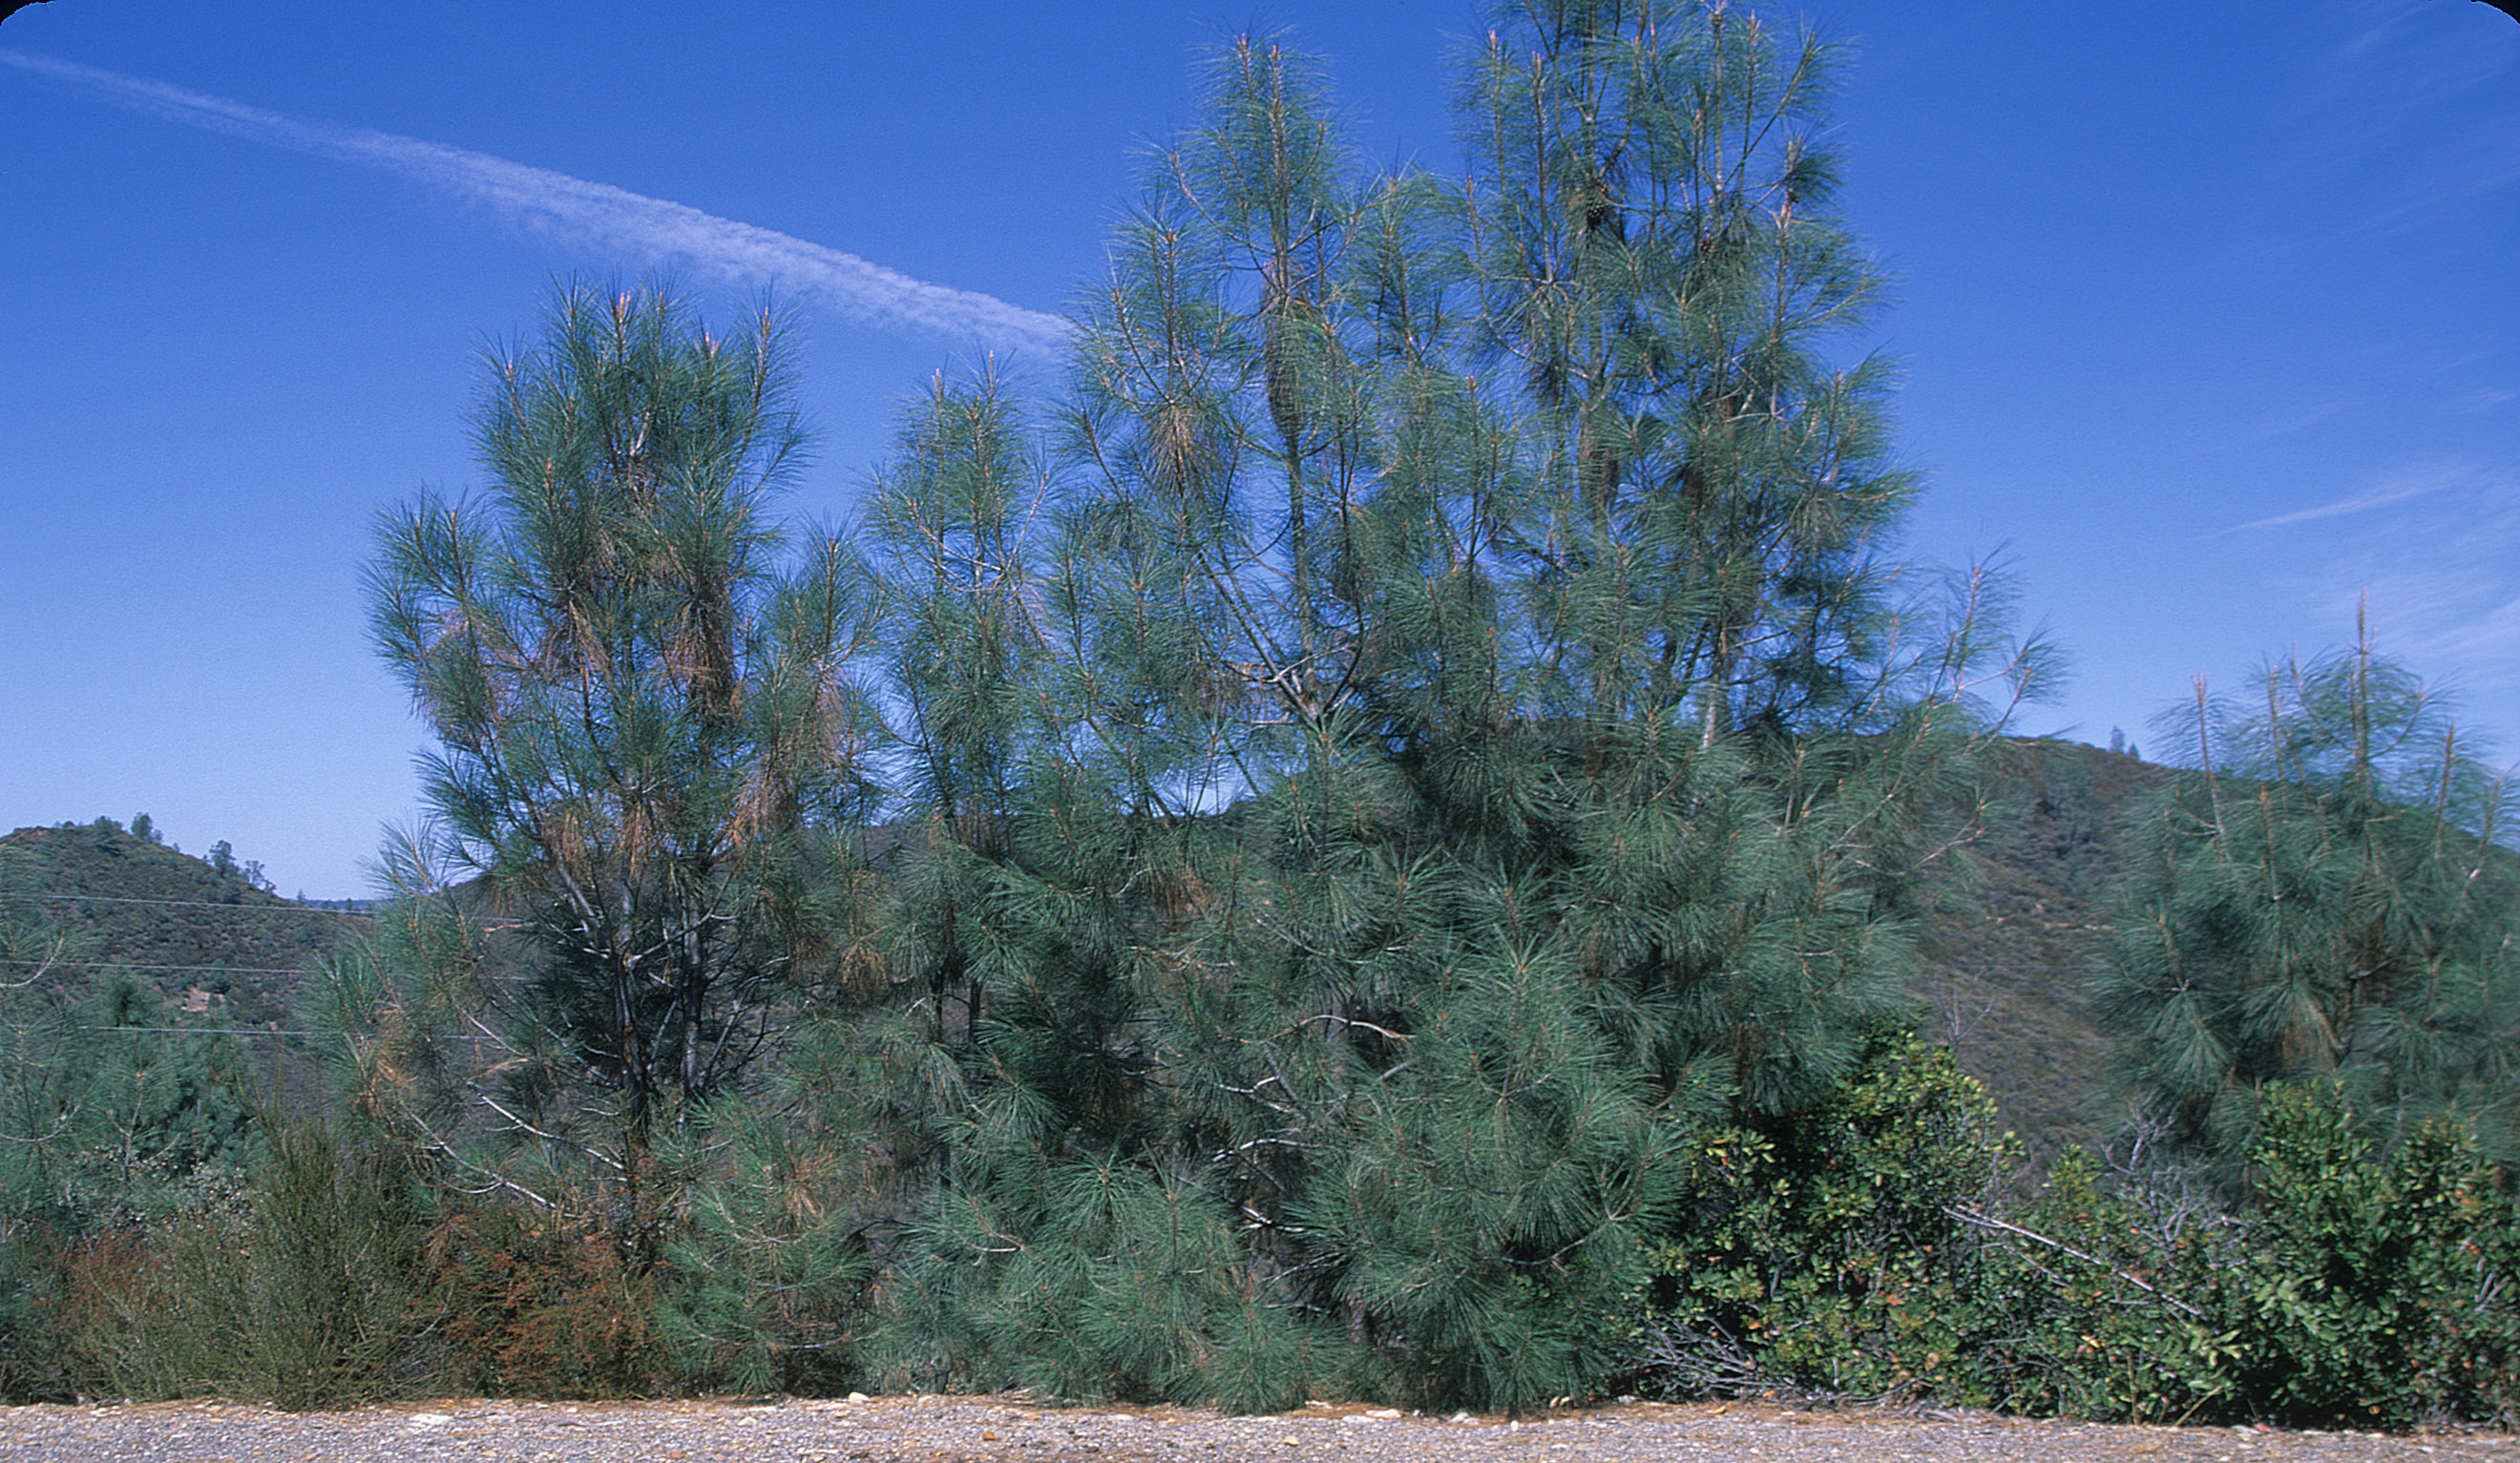
COLLECTION_LOCALITY: Flagstaff Hill, in El Dorado county, approximately 42 km northeast of Sacramento, California
COLLECTION_LATITUDE: 38.7810191 deg. N
COLLECTION_LONGITUDE: 121.085793 deg. W
DATUM: WGS-84
ORIGINAL_DONOR: Raymond F. Kokaly, USGS
SAMPLE_DESCRIPTION:
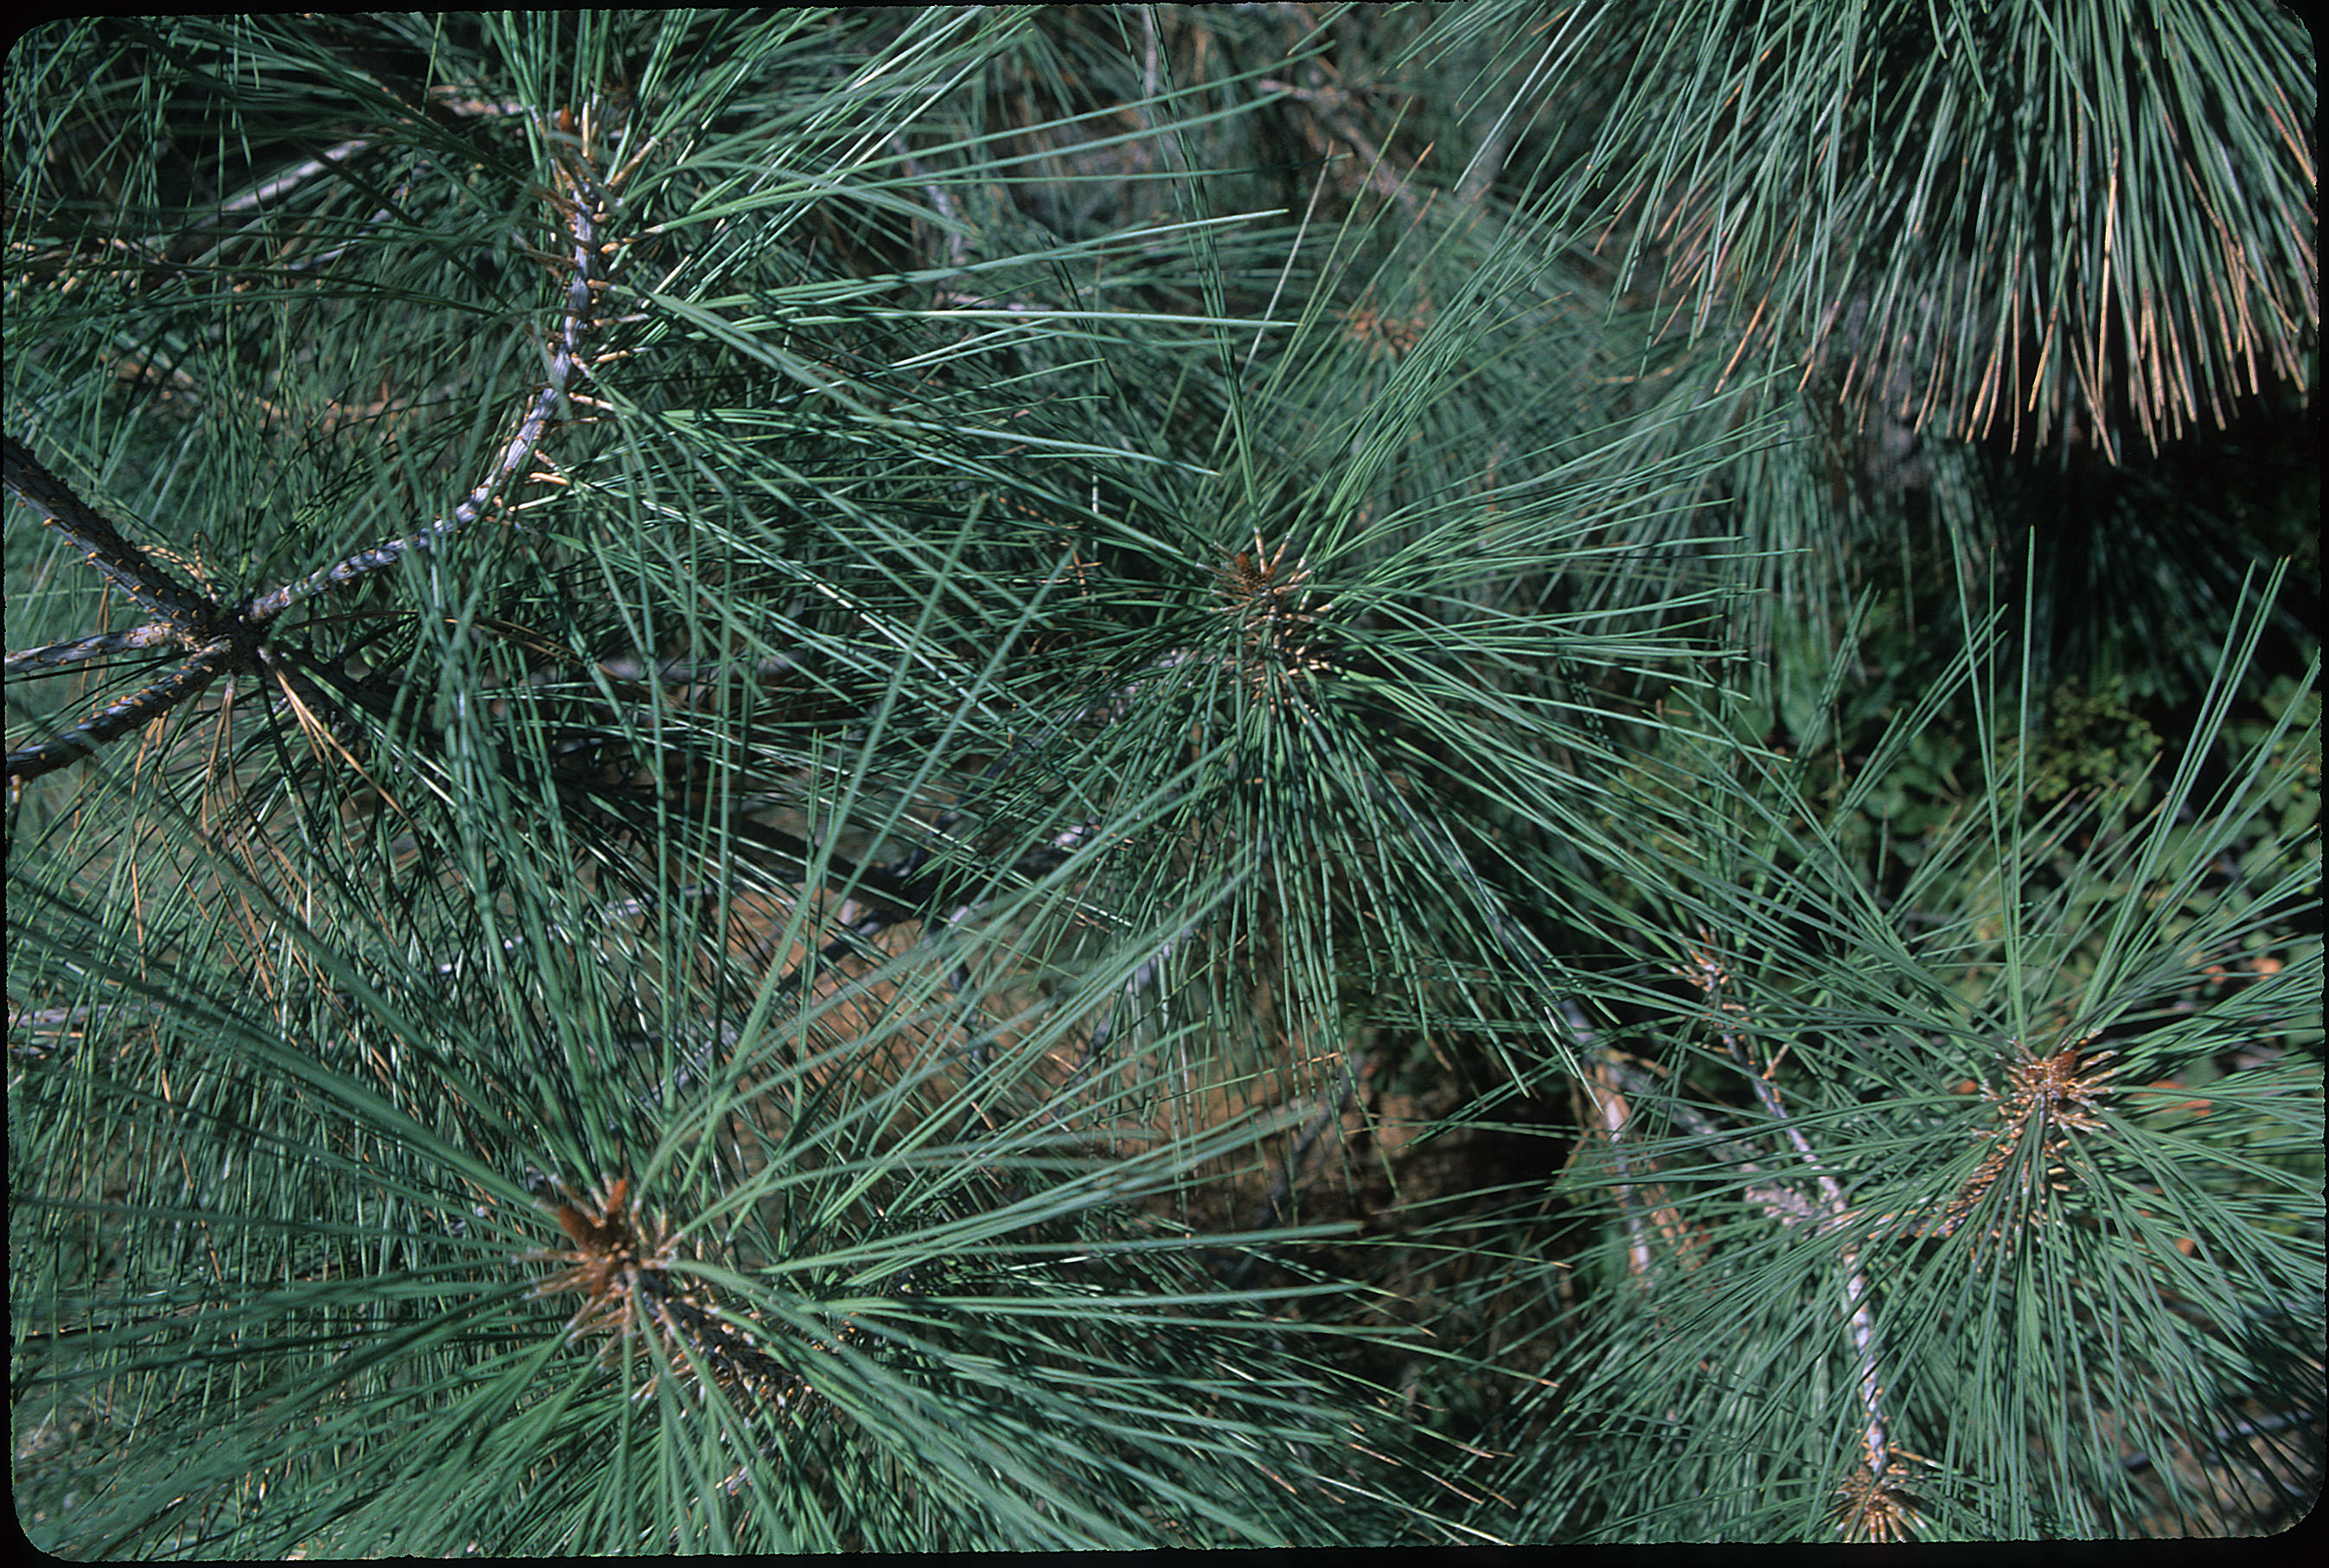
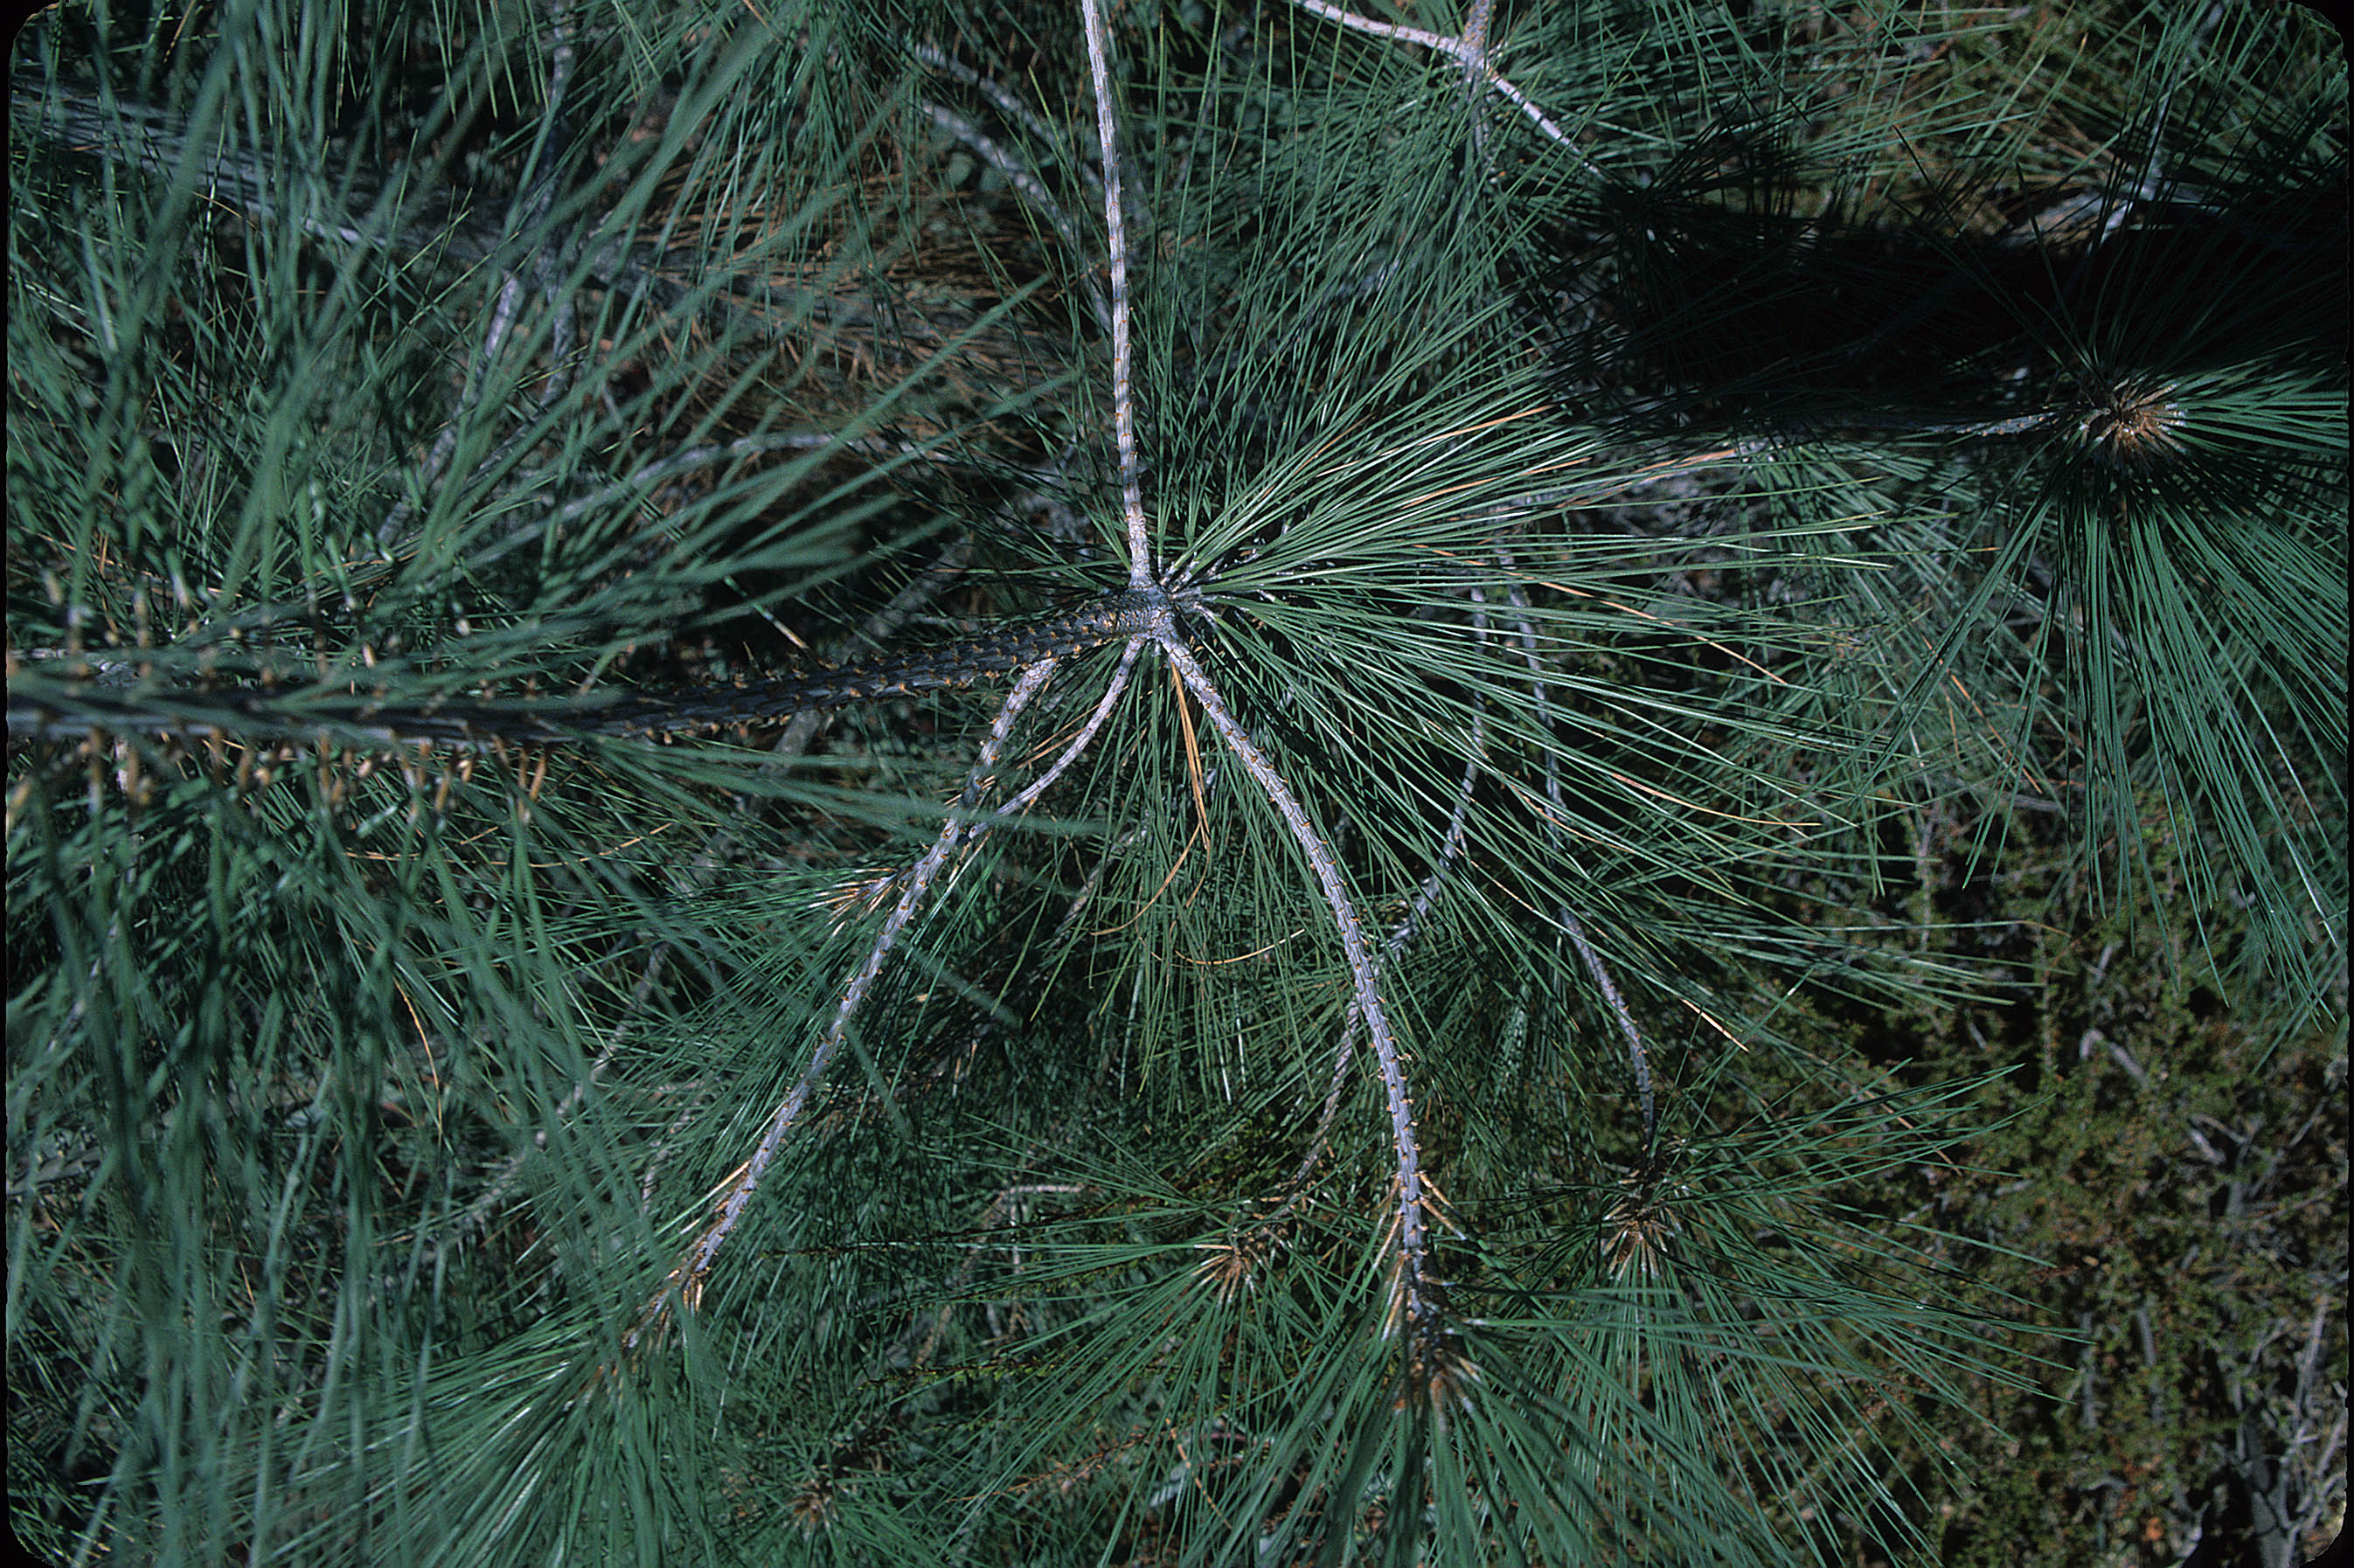
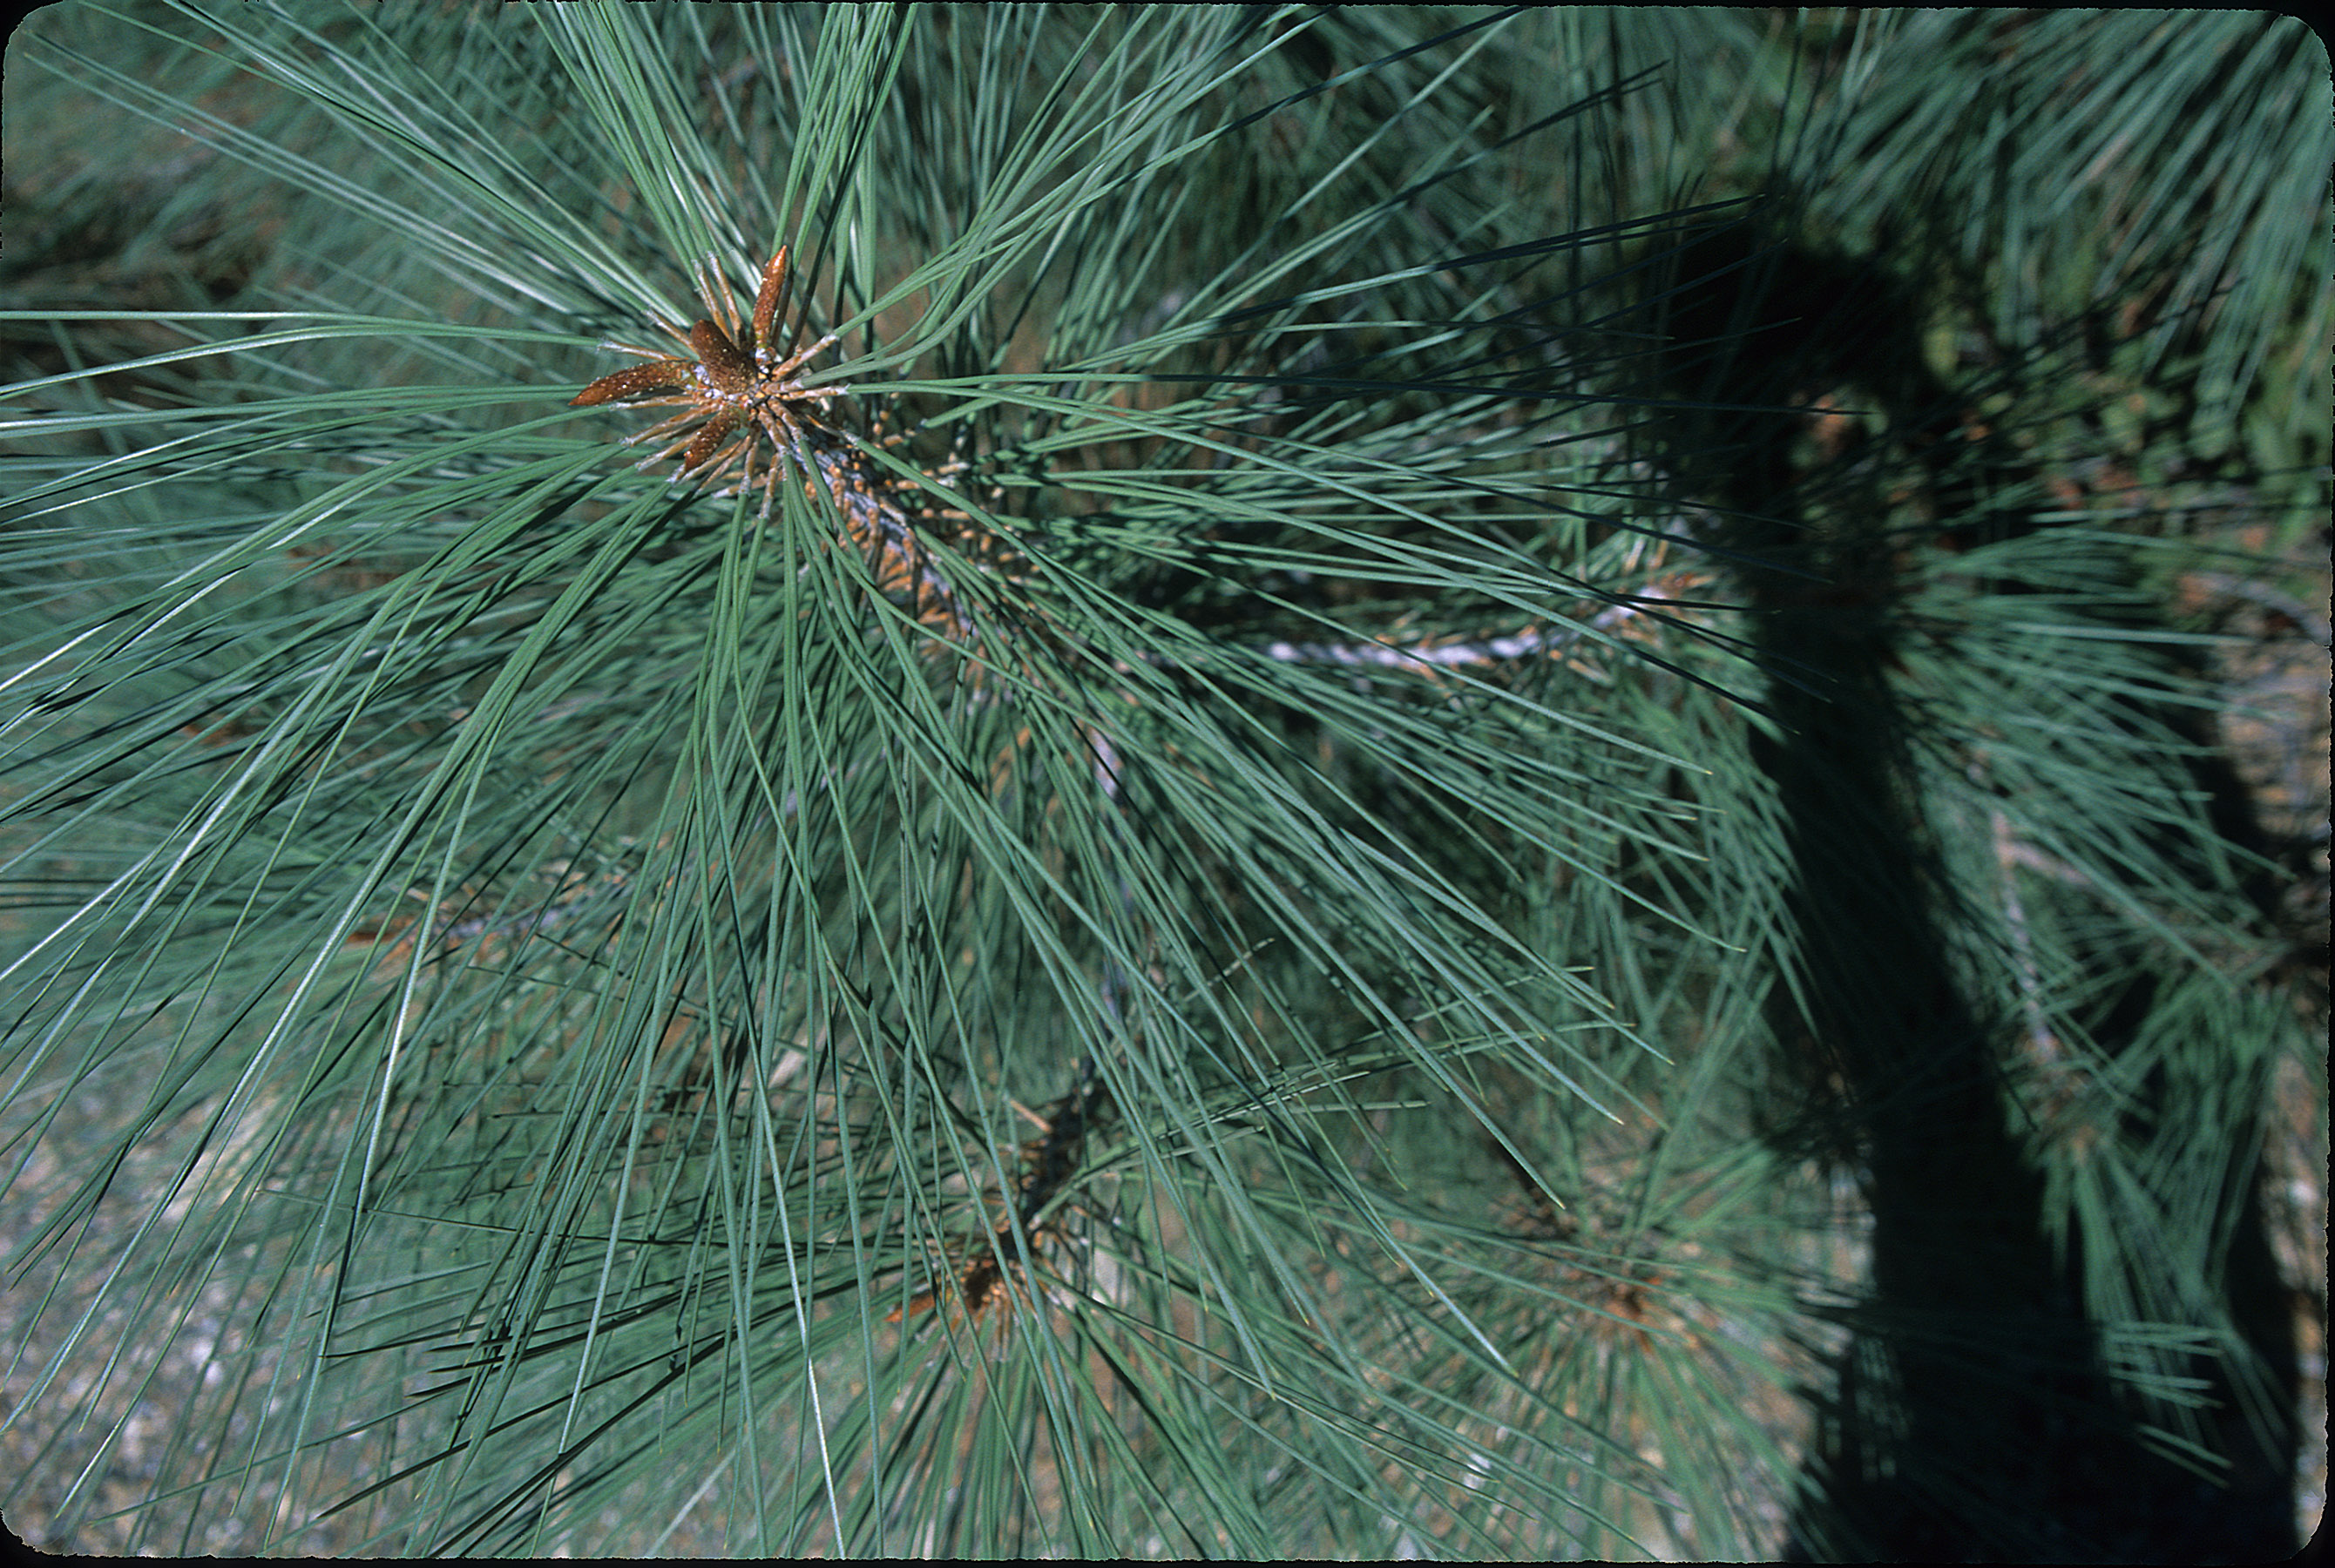
This spectrum is the average reflectance of 5 field measurements of the green needles on a branch of gray pine (Pinus sabiniana). Needles were 20 cm long with papery sheath 3 cm long where the joined the branch.Needle color was light green with white striations. Branch wood was gray in color, very flexible, and resinous. The spectrometer field of view was estimated to be, on average, 40% green needles, 10% branch wood, 10% dry fascicles (papery, white needle sheaths at the needle base), 20% shadows, and 20% soil/litter background. The measurements were made at 1:00 pm local time on September 3, 2001. These spectra were made using an ASD FullRange (653) in reflectance mode, relative to a Spectralon reference panel. The bare fiber of the spectrometer was used to measure the reflectance spectra of the branch. The fiber optic cable was pointed 15 degrees off-nadir 6 cm away from the branch and moved along the length of the branch during the measurement. The instrument was programmed to record 6 second averages of reflectance (thus, each recorded spectrum was an average of 60 individual measurements). An average spectrum was computed from the recorded measurements and converted to absolute reflectance by multiplying by the reflectance spectrum of the Spectralon reference panel. Other samples of gray pine were also measured at this location and are included in this spectral library, samples names: CA01-PISA-2 to CA01-PISA-3.
This spectrum was used in the following publication:
Swayze, G.A., Kokaly, R.F., Higgins, C.T., Clinkenbeard, J.P., Clark, R.N., Lowers, H.A, Sutley, and S.J., 2009,
Mapping potentially asbestos-bearing rocks using imaging spectroscopy, Geology Volume 37, pages 763-766.
http://dx.doi.org/10.1130/G30114A.1
IMAGE_OF_SAMPLE:
END_SAMPLE_DESCRIPTION.
COMPOSITIONAL_ANALYSIS_TYPE: None
COMPOSITION_DISCUSSION:
END_COMPOSITION_DISCUSSION.
TRACE_ELEMENT_ANALYSIS:
TRACE_ELEMENT_DISCUSSION:
END_TRACE_ELEMENT_DISCUSSION.
SPECTROSCOPIC_DISCUSSION:
END_SPECTROSCOPIC_DISCUSSION.
SPECTRAL_PURITY: 1a2_3_4_ # 1= 0.2-3, 2= 1.5-6, 3= 6-25, 4= 20-150 microns