
|
DOCUMENTATION_FORMAT: PLANT
SAMPLE_ID: CA01-TACA-1
PLANT_TYPE: Grass
PLANT: Mixed grasses, dominated by medusa head grass
LATIN_NAME: Taeniatherum caput-medusae (L.) Nevski
COLLECTION_LOCALITY: West-side of Flagstaff Hill, west of serpentenite rocks, in El Dorado county, approximately 40 km northeast of Sacramento, California
COLLECTION_LATITUDE: 38.775555 deg. N
COLLECTION_LONGITUDE: 121.091944 deg. W
DATUM: WGS-84
ORIGINAL_DONOR: Raymond F. Kokaly, USGS
SAMPLE_DESCRIPTION:
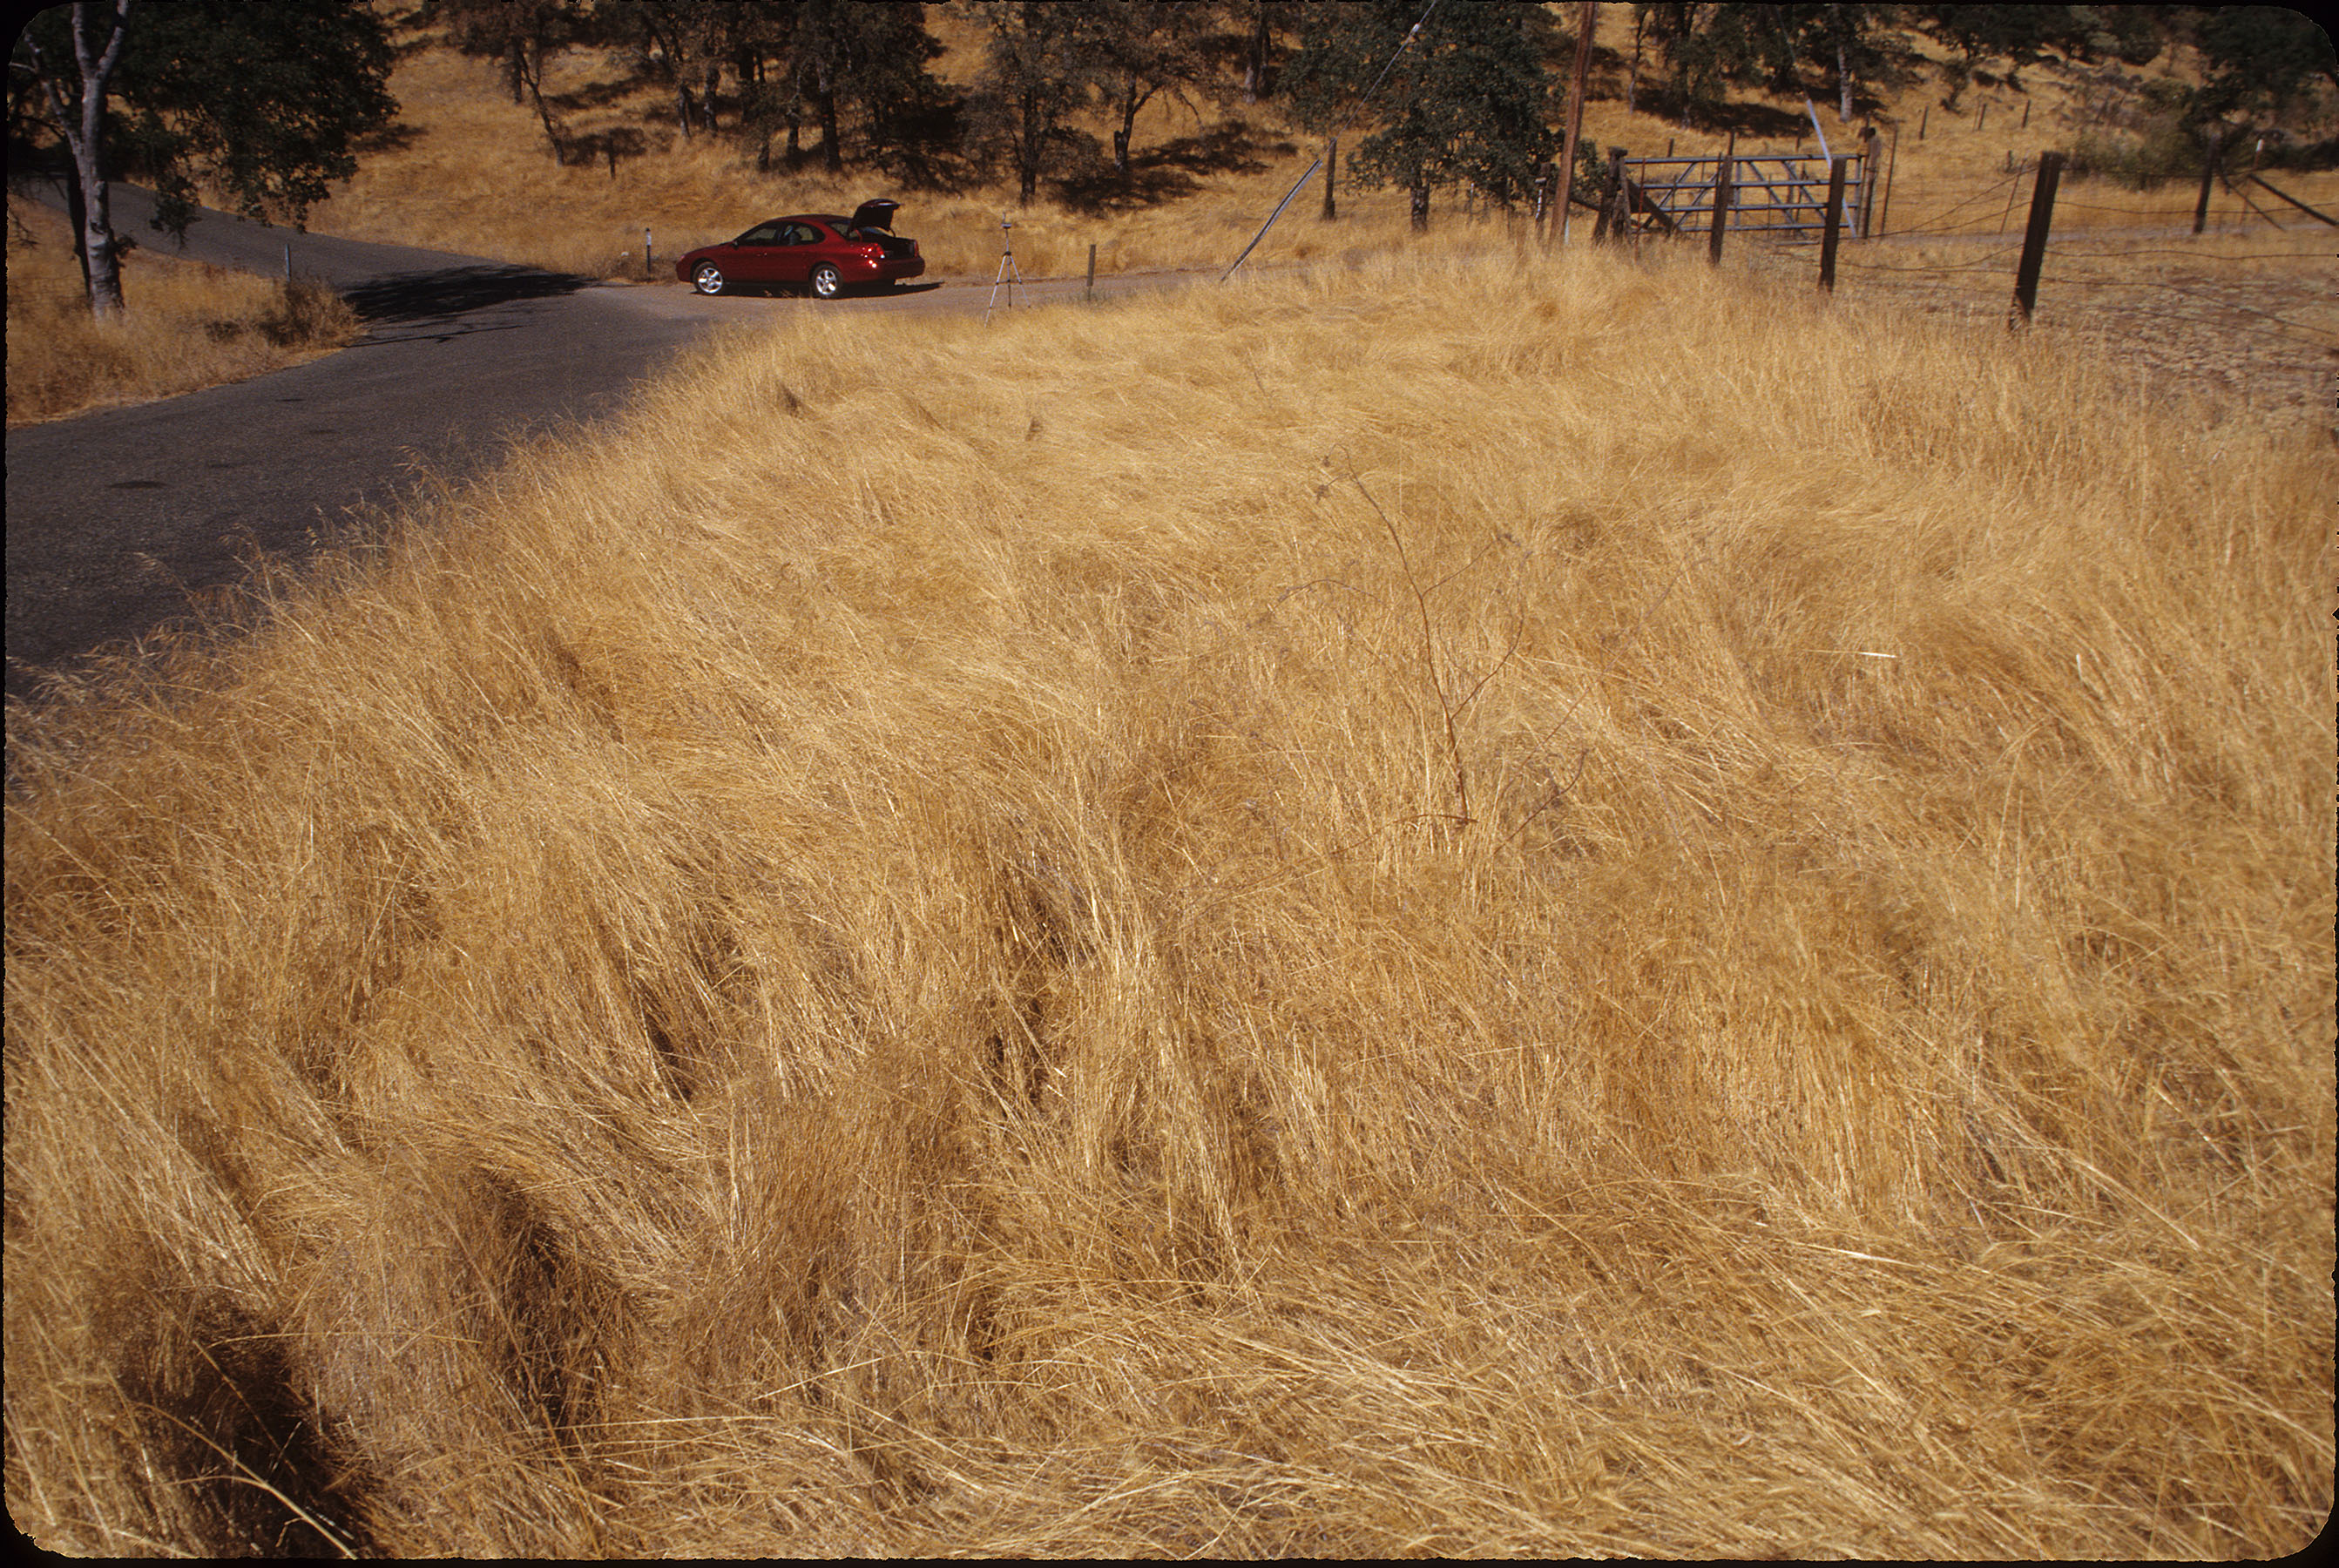
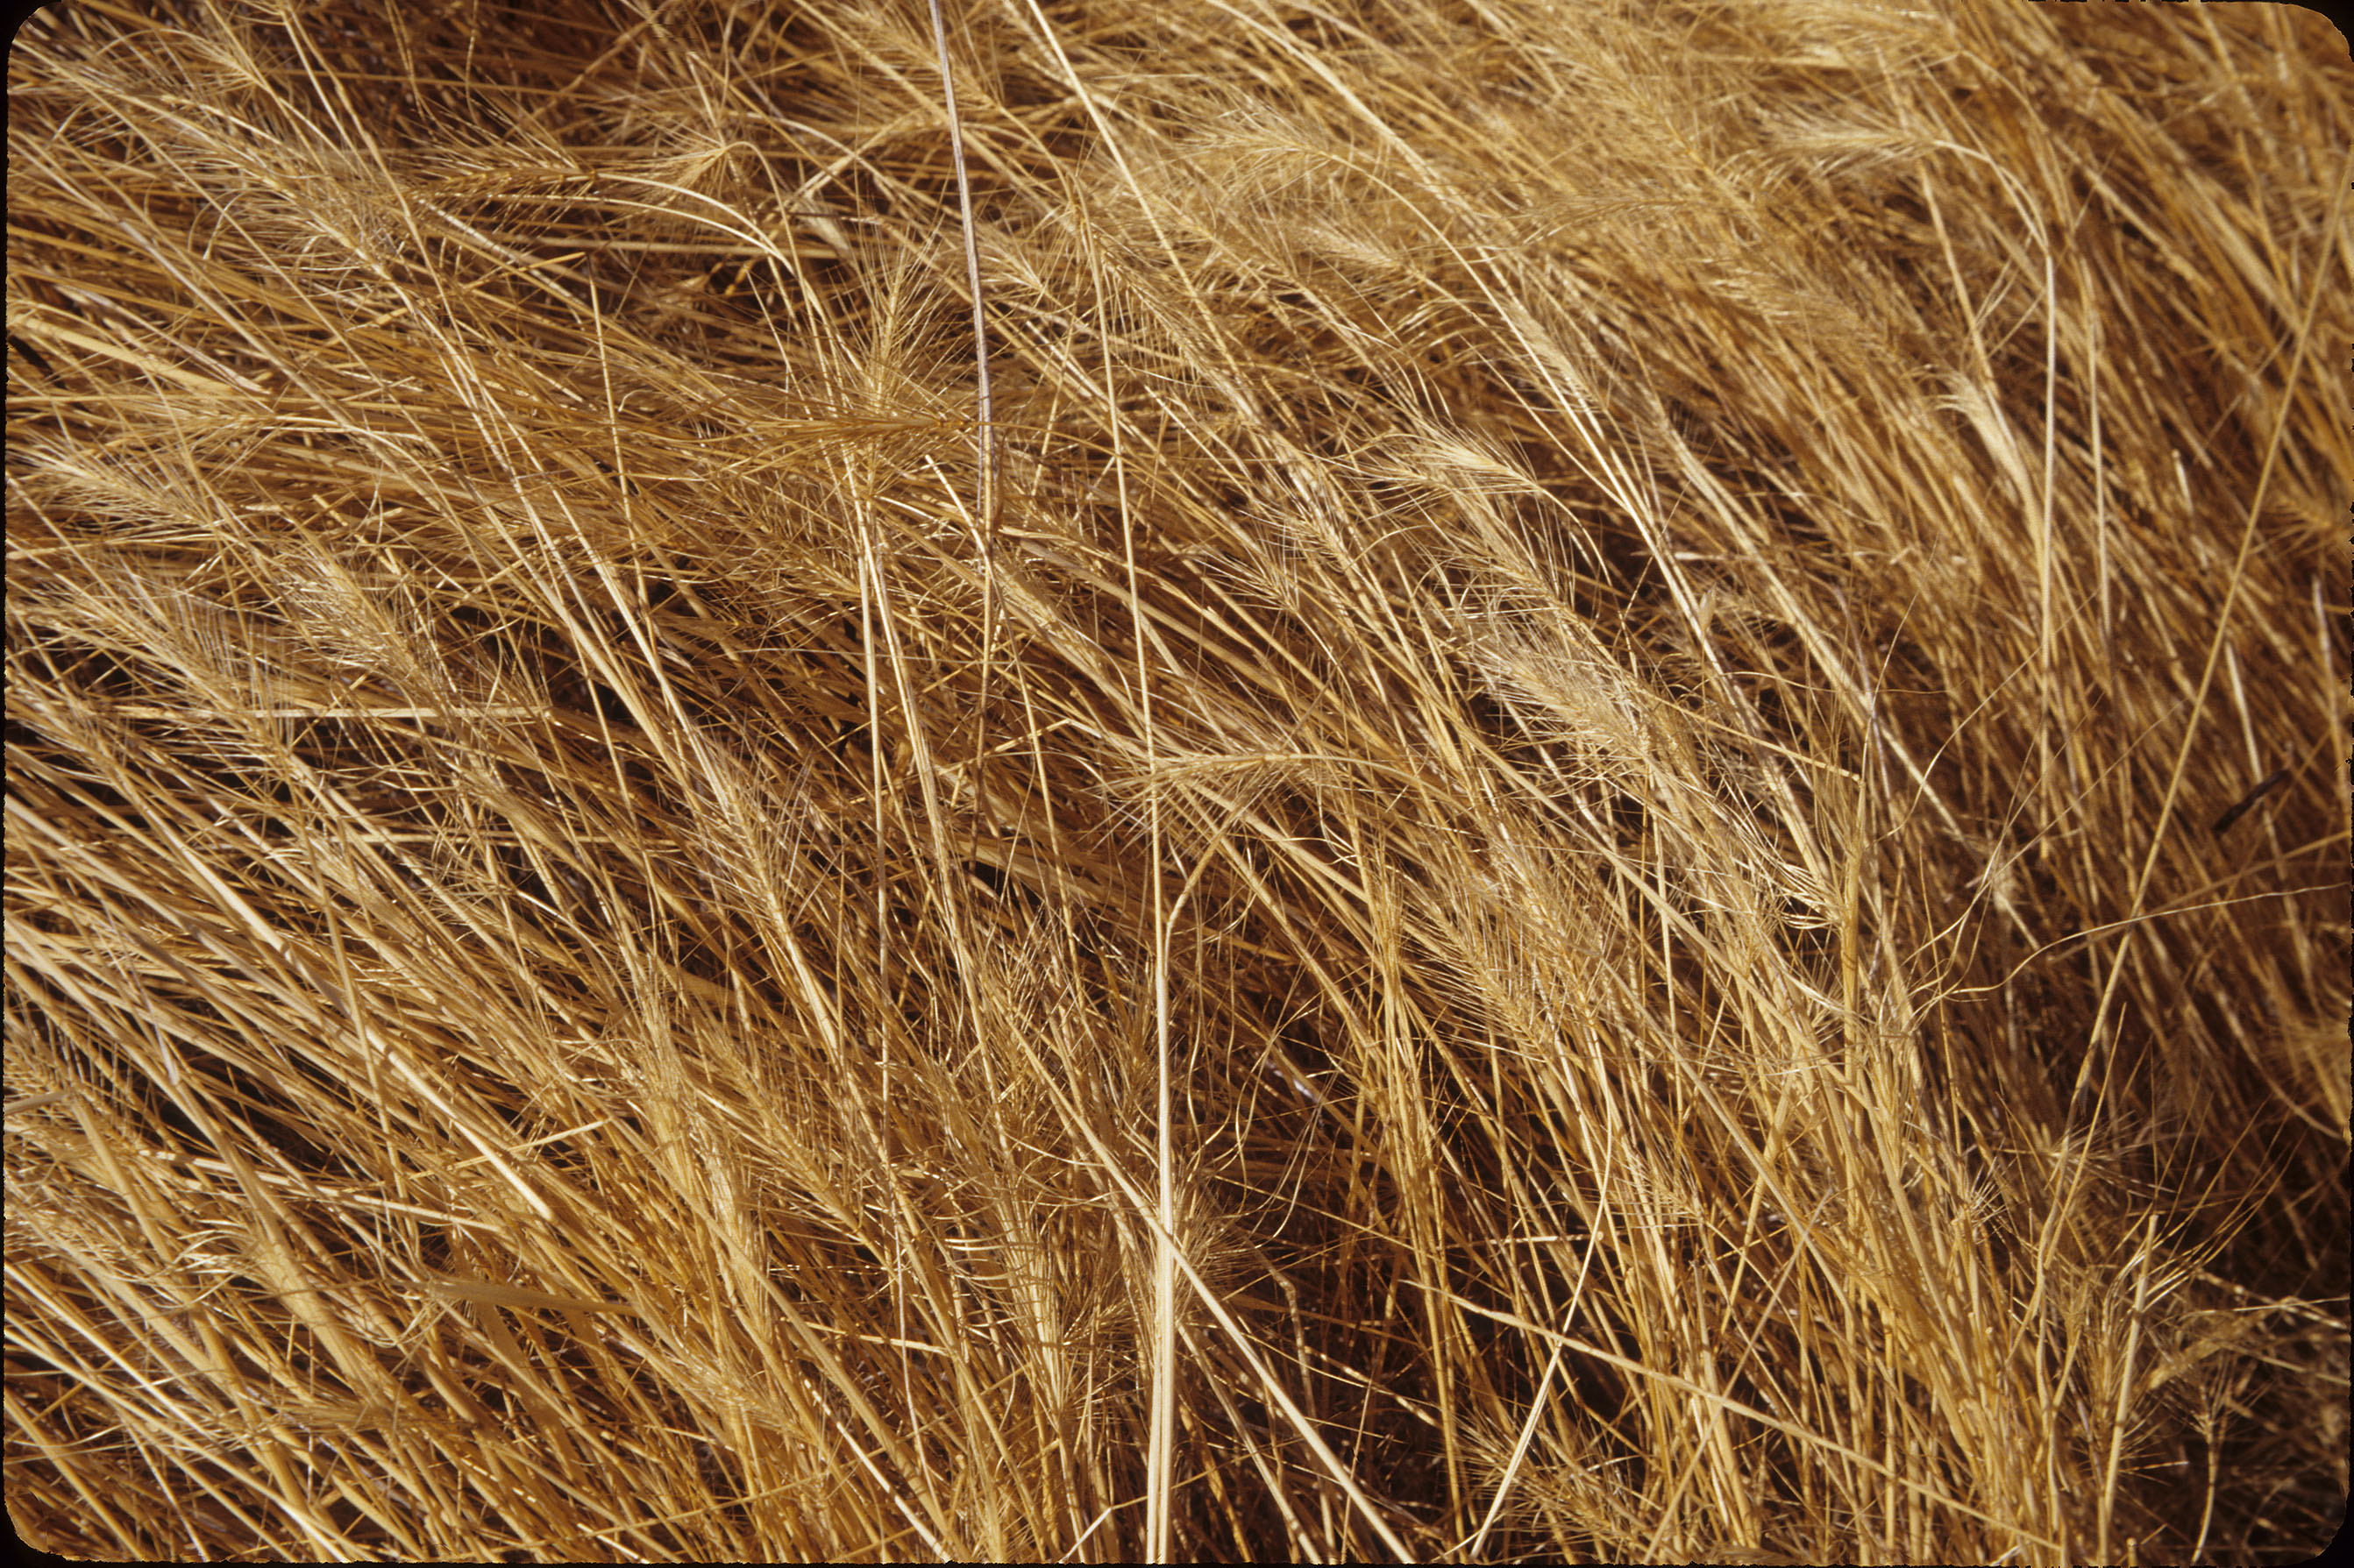
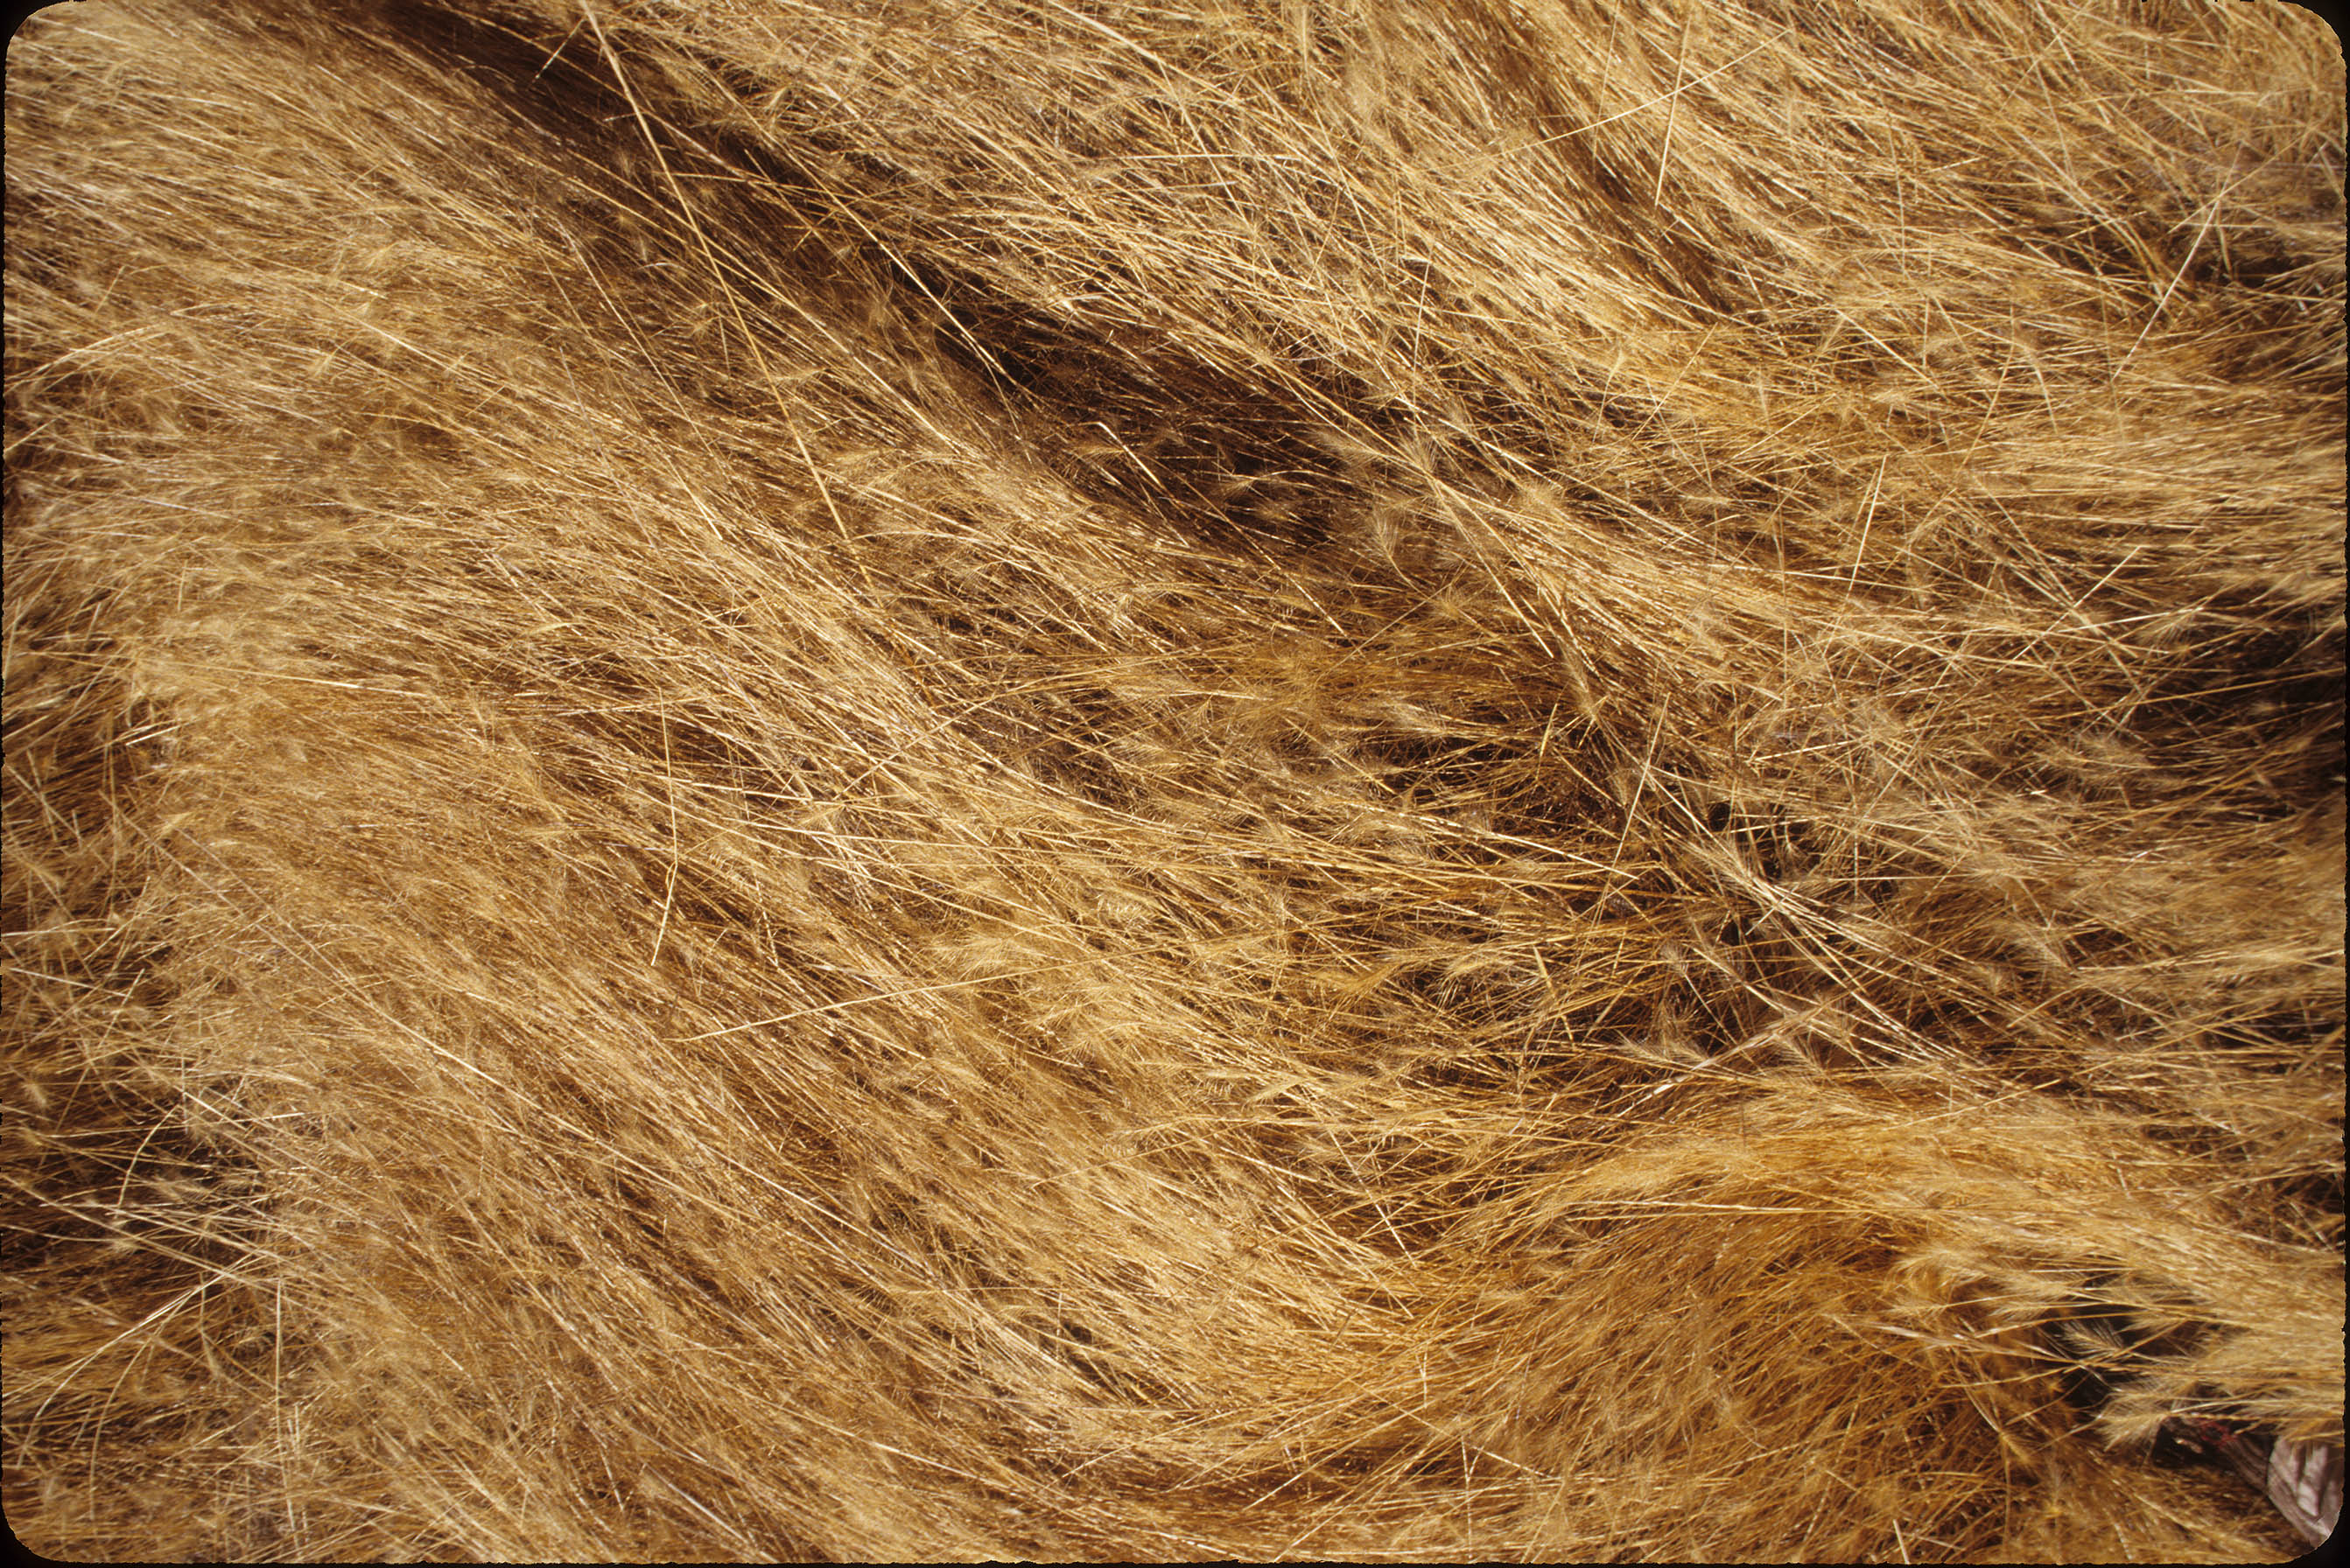
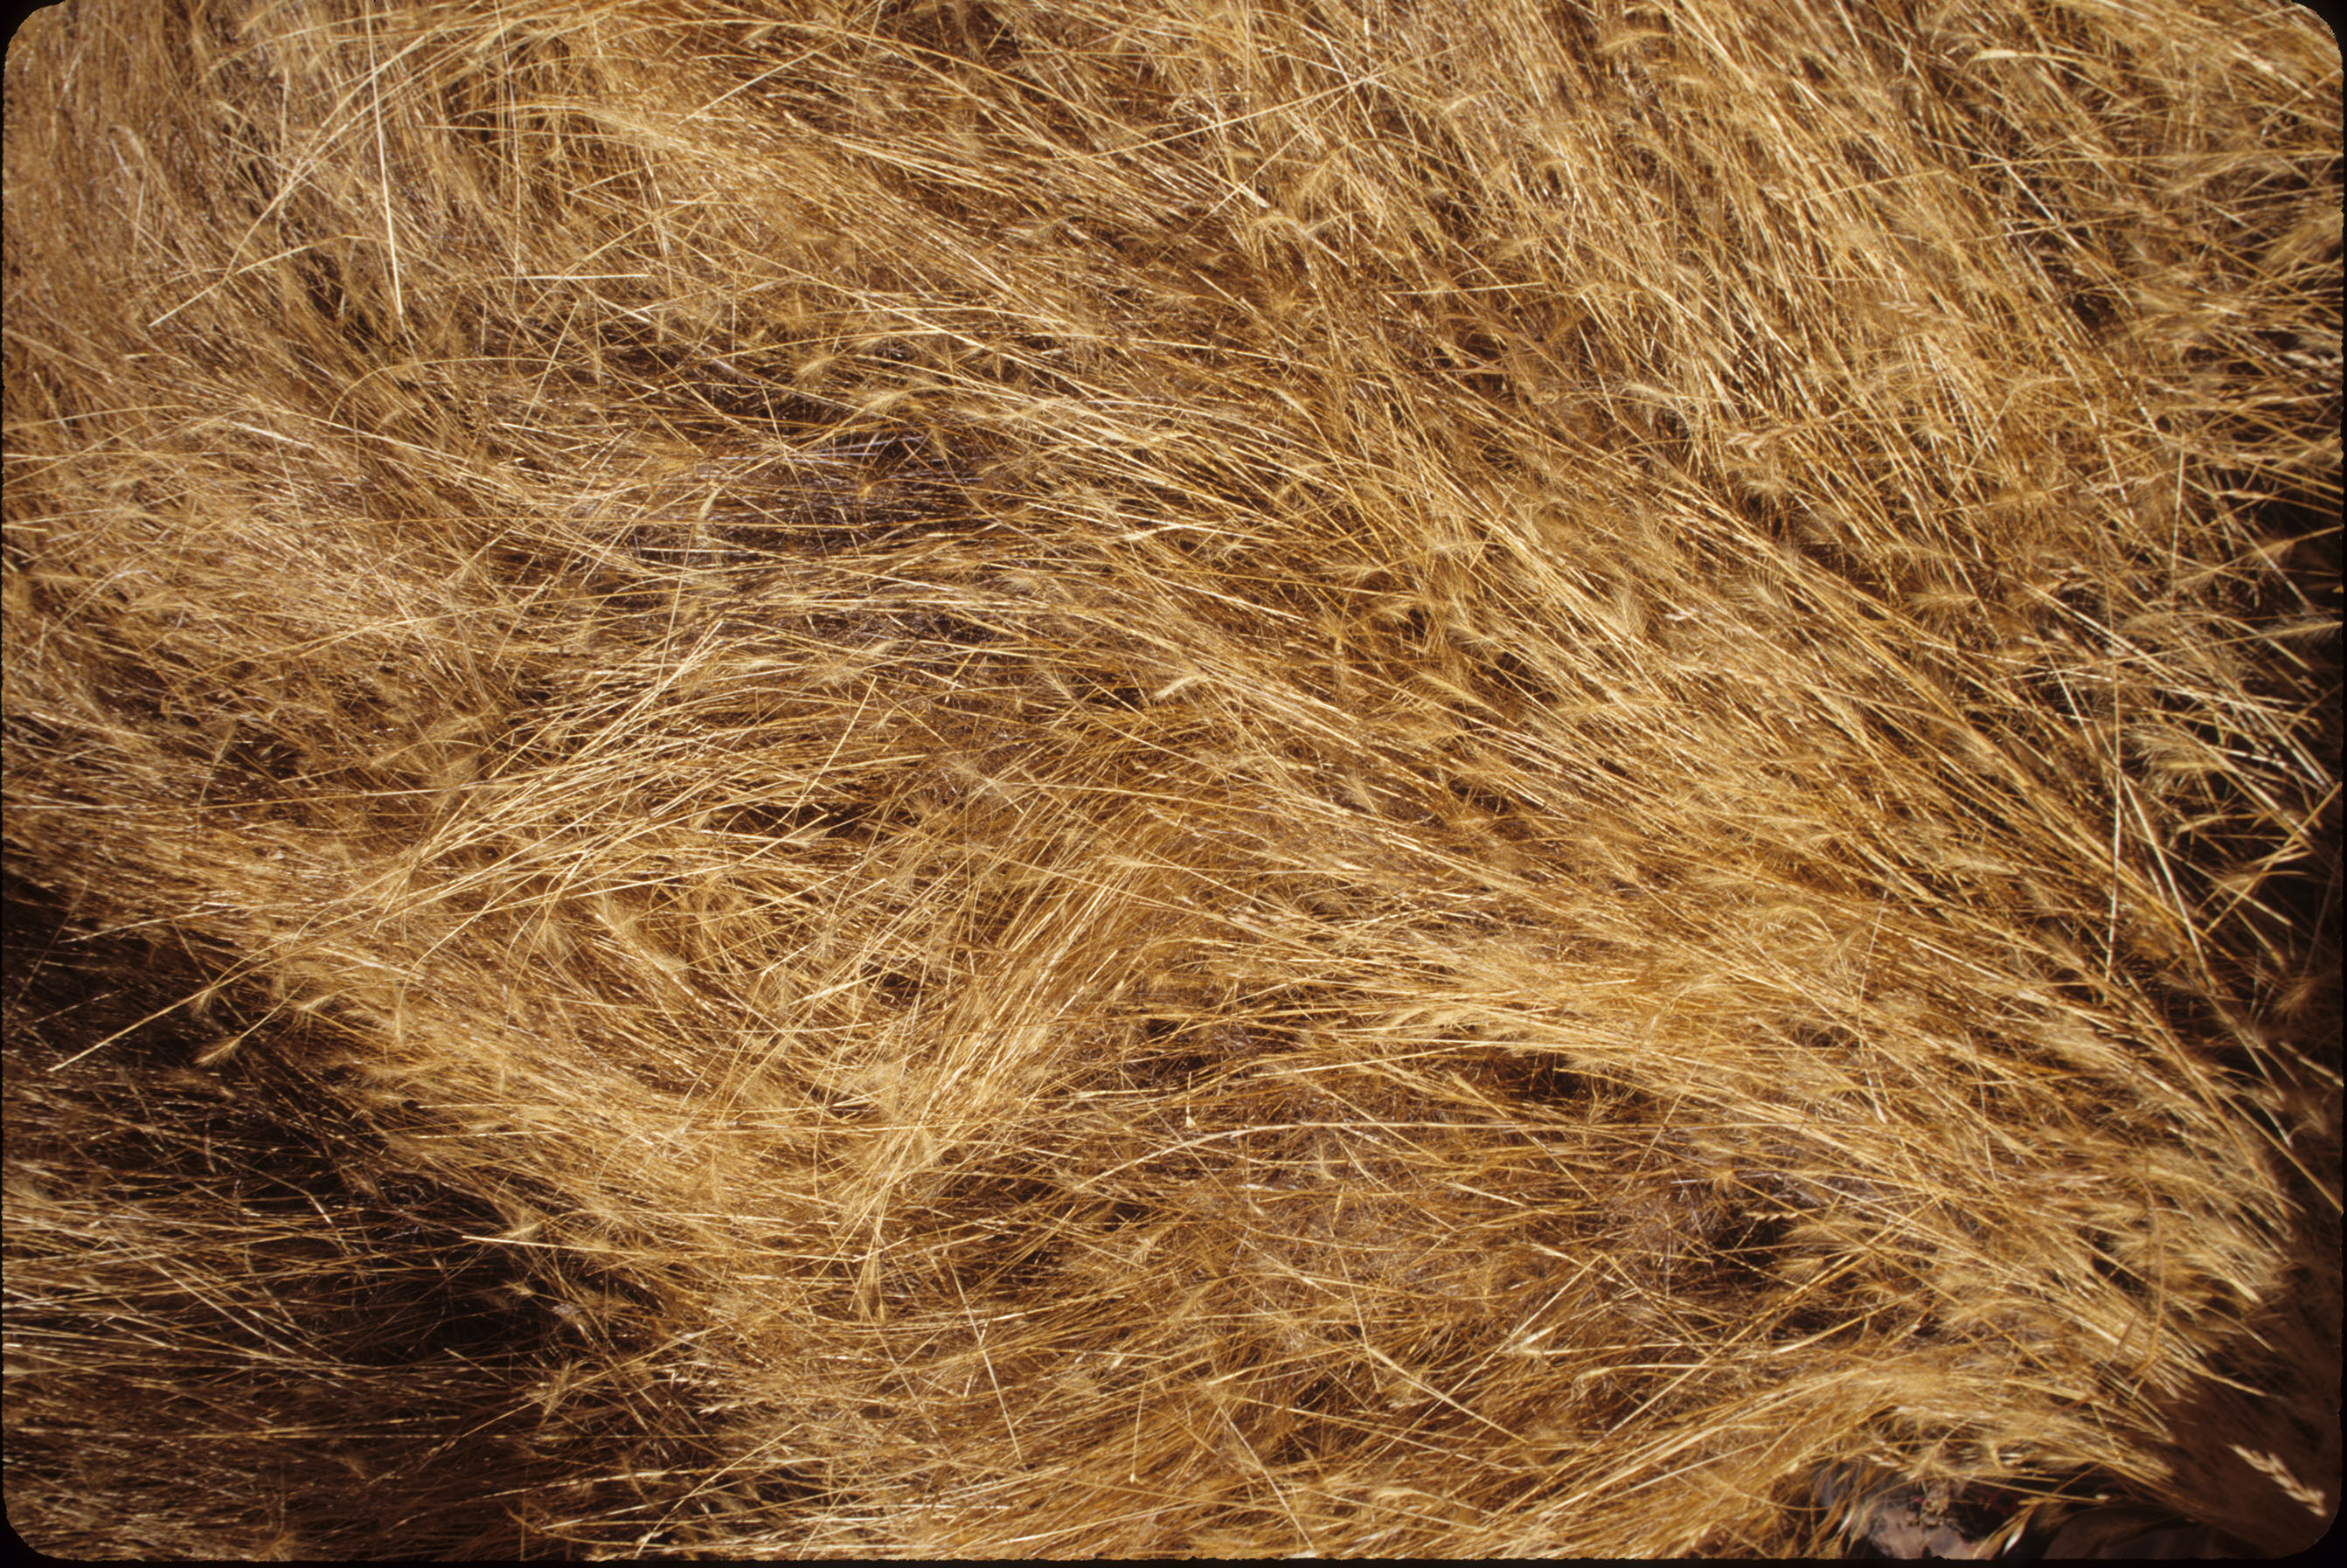
This spectrum is the average reflectance of 41 field measurements of a grass meadow dominated by medusa head grass (Taeniatherum caput-medusae). The measurements were made at 4:00 pm local time on September 3, 2001. These spectra were made using an ASD FullRange spectrometer (model 653) in reflectance mode, relative to a Spectralon reference panel. The bare fiber of the spectrometer was used to measure the reflectance spectra of the meadow. The medusa head grass meadow was located adjacent to the road at mile marker 7801. The grass was yellow-gold in color and in a dry, non-photosynthetic (NPV) state. The dominant grass was medusa head. The fiber optic cable was pointed at nadir and held at shoulder height while walking through the grass meadow. On average the grass cover was 95%, while shadows and exposed bare soil were both 2.5% of the cover. The instrument was programmed to record 6 second averages of reflectance (thus, each recorded spectrum was an average of 60 individual measurements). An average spectrum was computed from the recorded measurements and converted to absolute reflectance by multiplying by the reflectance spectrum of the Spectralon reference panel.
This spectrum was used in the following publication:
Swayze, G.A., Kokaly, R.F., Higgins, C.T., Clinkenbeard, J.P., Clark, R.N., Lowers, H.A, Sutley, and S.J., 2009,
Mapping potentially asbestos-bearing rocks using imaging spectroscopy, Geology Volume 37, pages 763-766.
http://dx.doi.org/10.1130/G30114A.1
IMAGE_OF_SAMPLE:
END_SAMPLE_DESCRIPTION.
COMPOSITIONAL_ANALYSIS_TYPE: None
COMPOSITION_DISCUSSION:
END_COMPOSITION_DISCUSSION.
TRACE_ELEMENT_ANALYSIS:
TRACE_ELEMENT_DISCUSSION:
END_TRACE_ELEMENT_DISCUSSION.
SPECTROSCOPIC_DISCUSSION:
END_SPECTROSCOPIC_DISCUSSION.
SPECTRAL_PURITY: 1a2_3_4_ # 1= 0.2-3, 2= 1.5-6, 3= 6-25, 4= 20-150 microns