
|
DOCUMENTATION_FORMAT: PLANT
SAMPLE_ID: CA01-ADFA-1
PLANT_TYPE: California chaparral shrub
PLANT: Chamise
LATIN_NAME: Adenostoma fasciculatum Hook. & Arn.
COLLECTION_LOCALITY: Flagstaff Hill, in El Dorado county, approximately 42 km northeast of Sacramento, California
COLLECTION_LATITUDE: 38.781019 deg. N
COLLECTION_LONGITUDE: 121.086862 deg. W
DATUM: WGS-84
ORIGINAL_DONOR: Raymond F. Kokaly, USGS
SAMPLE_DESCRIPTION:
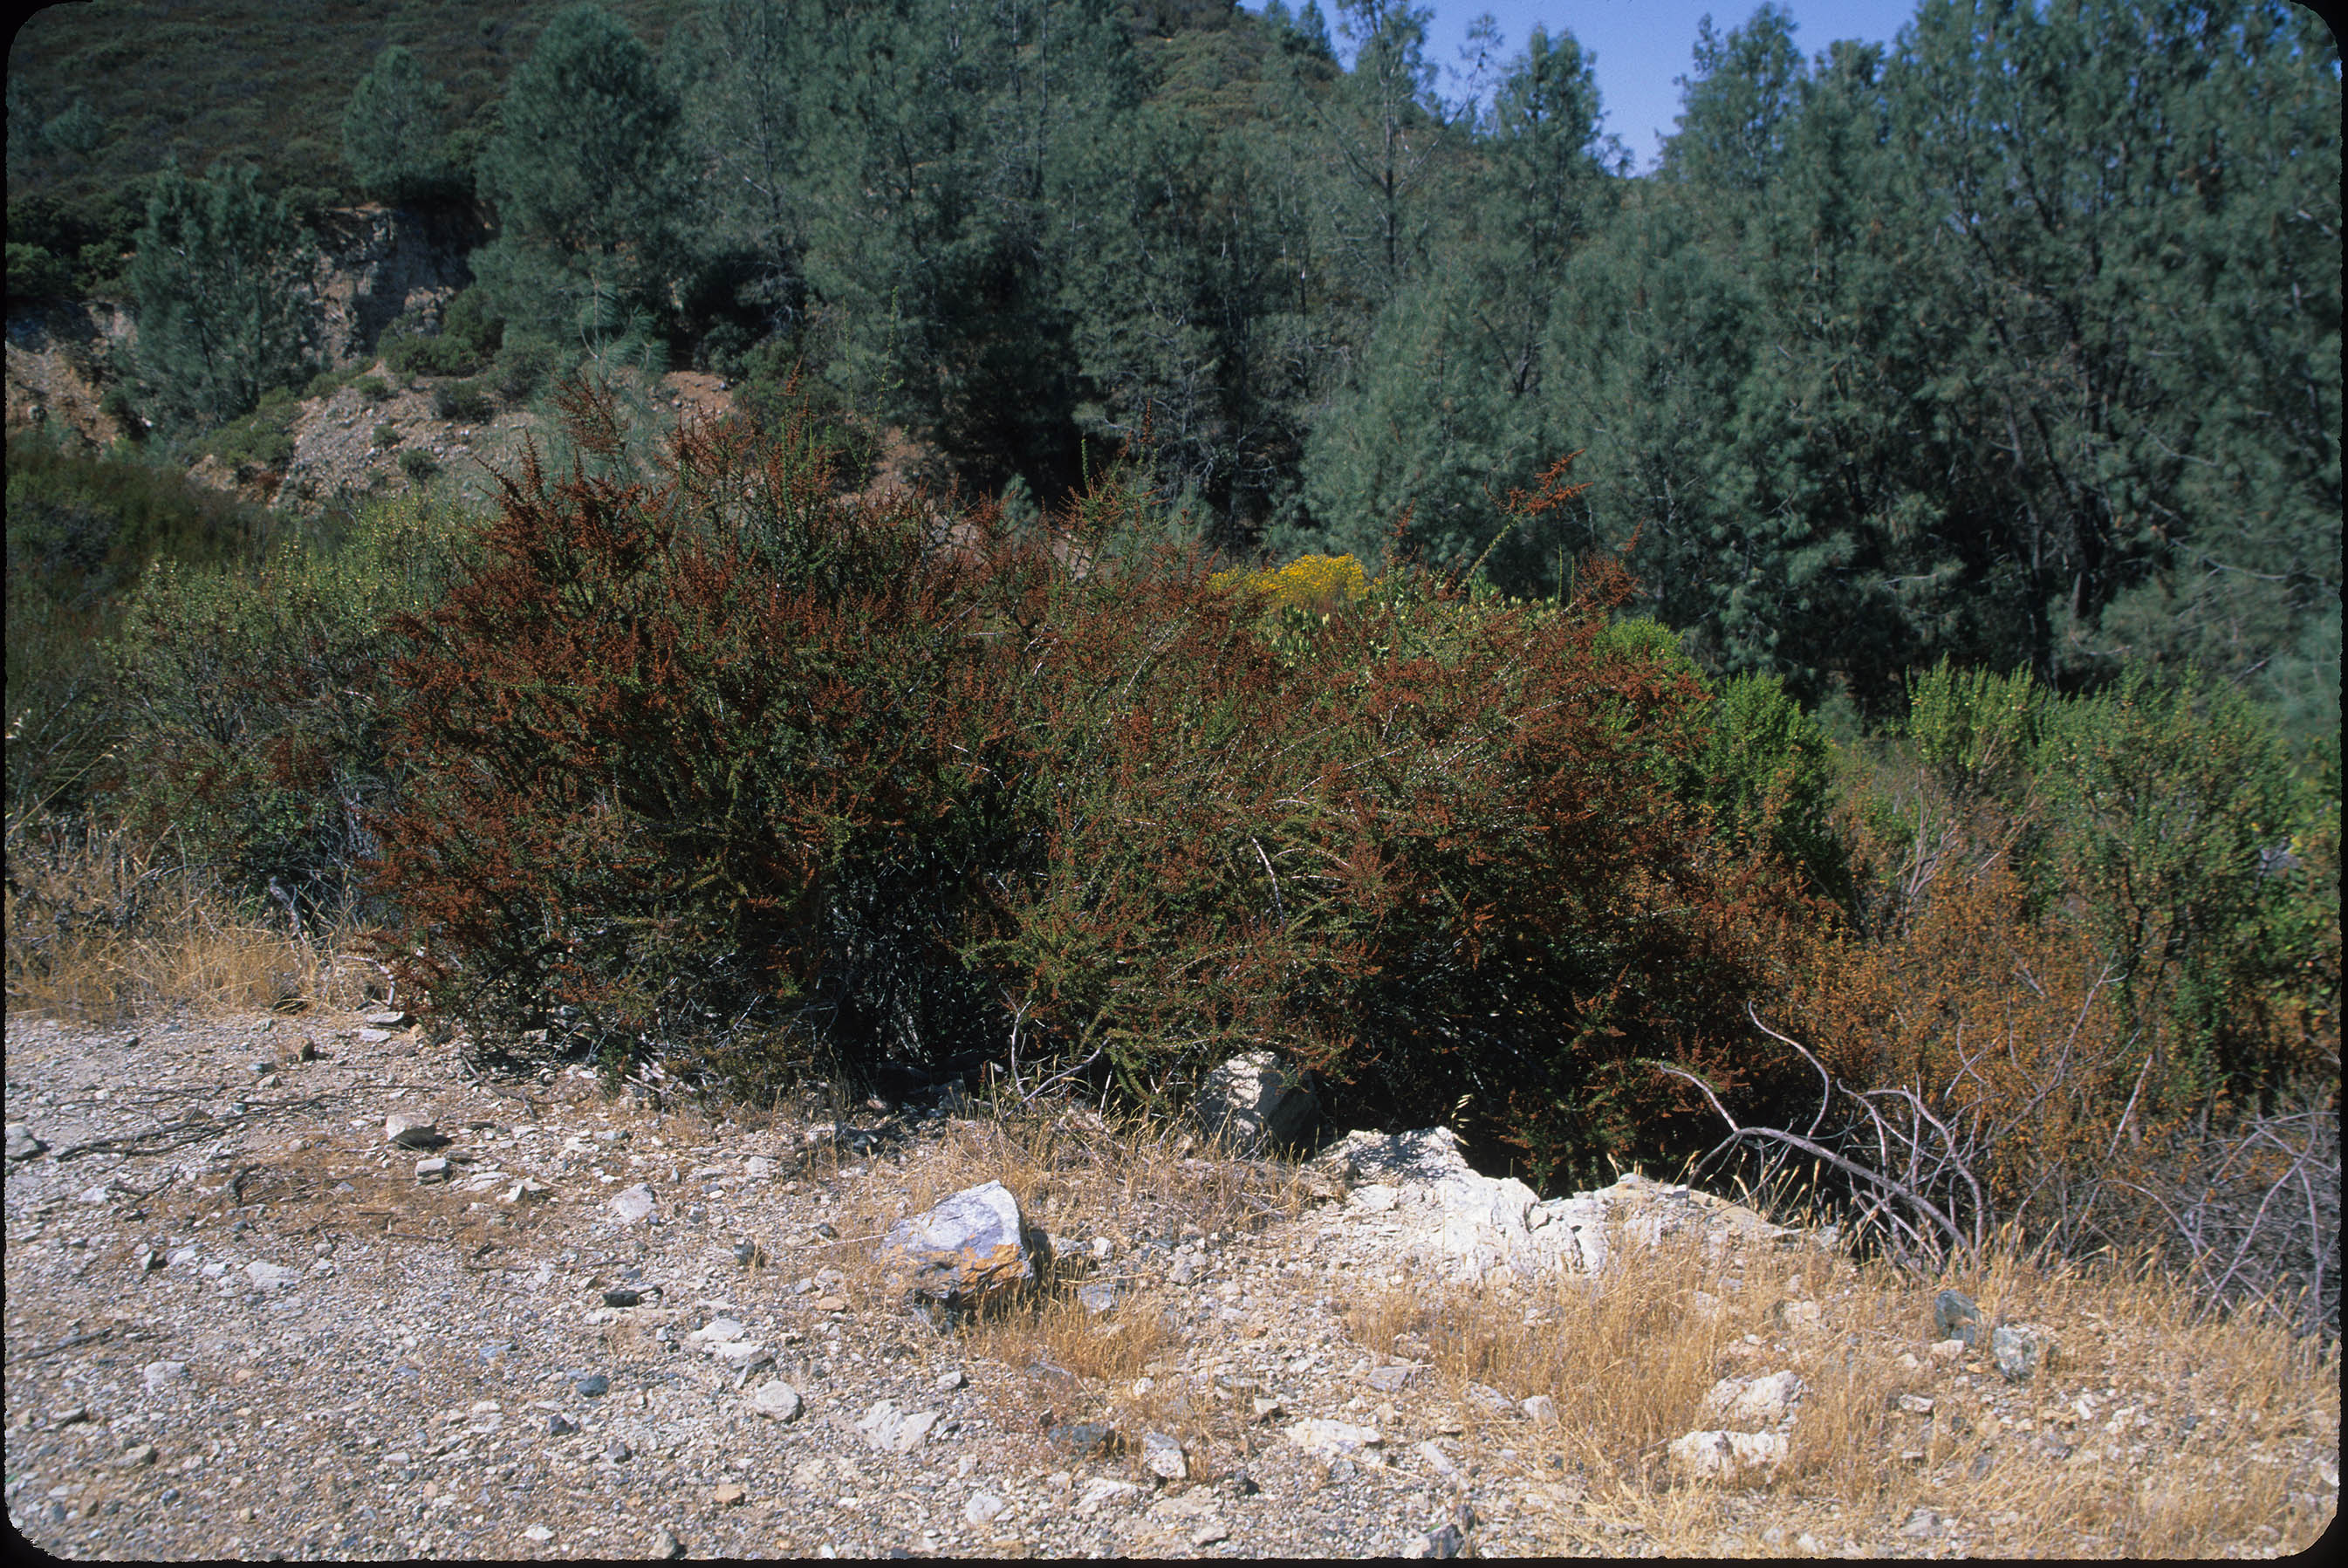
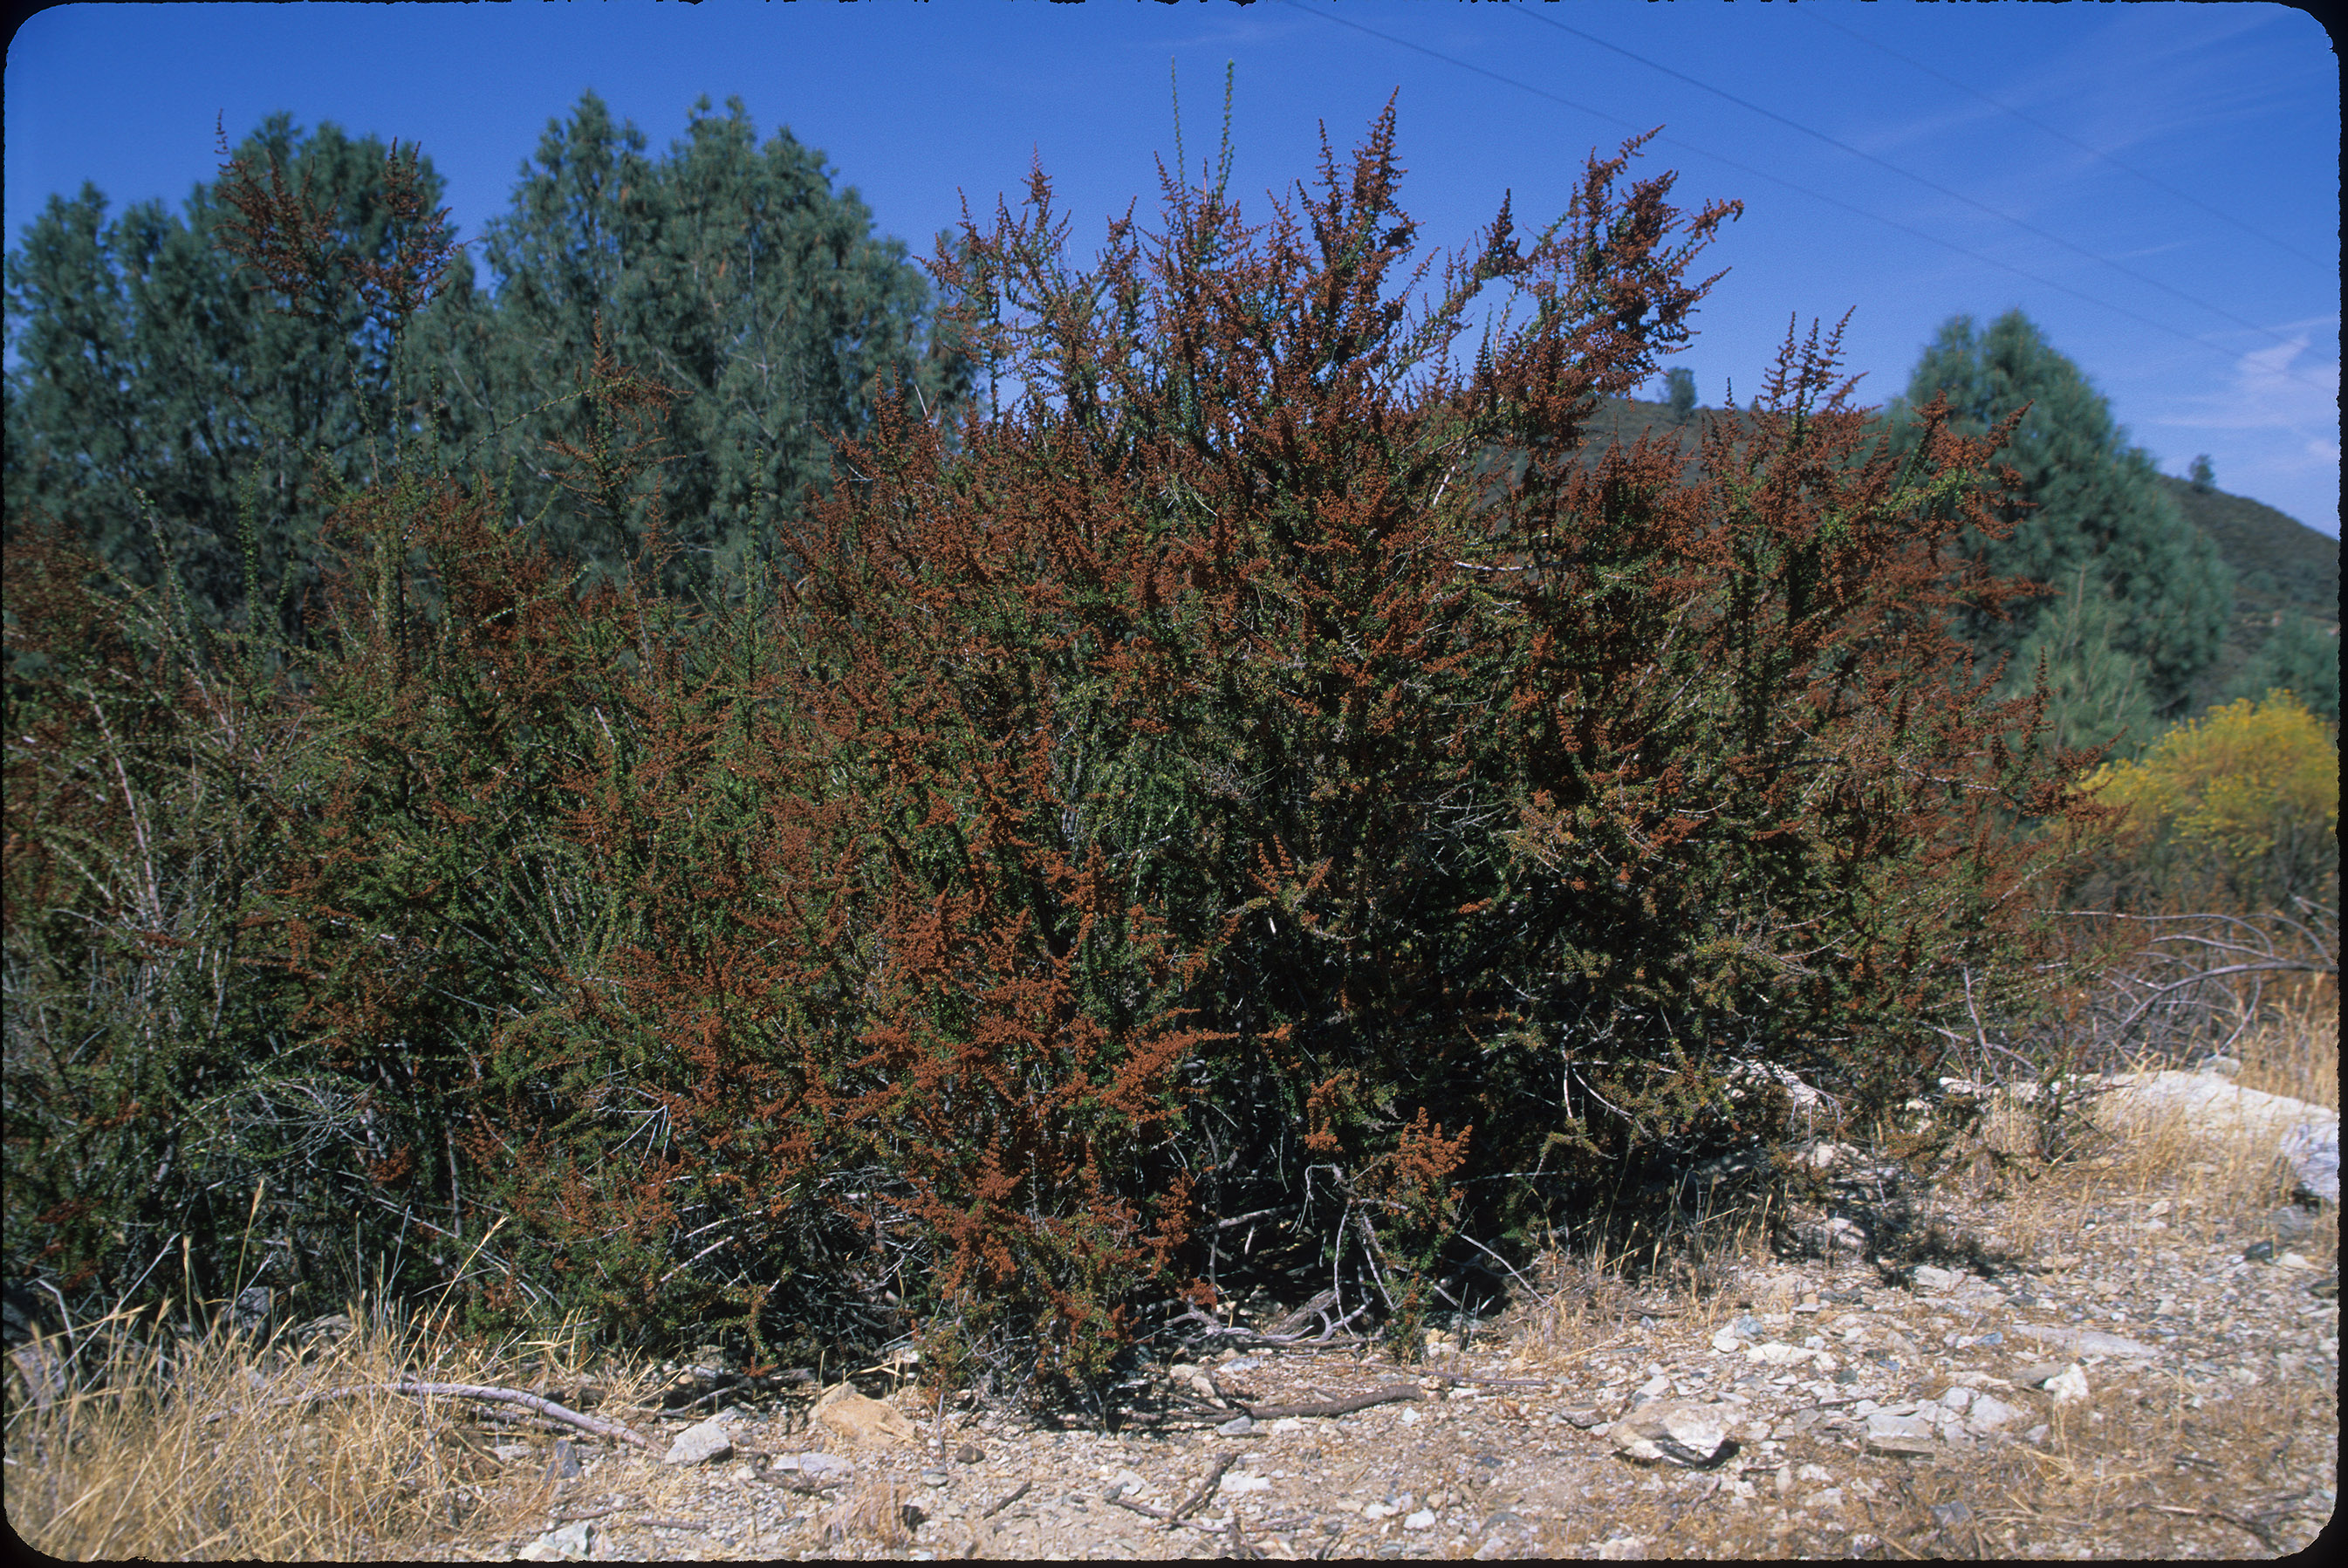
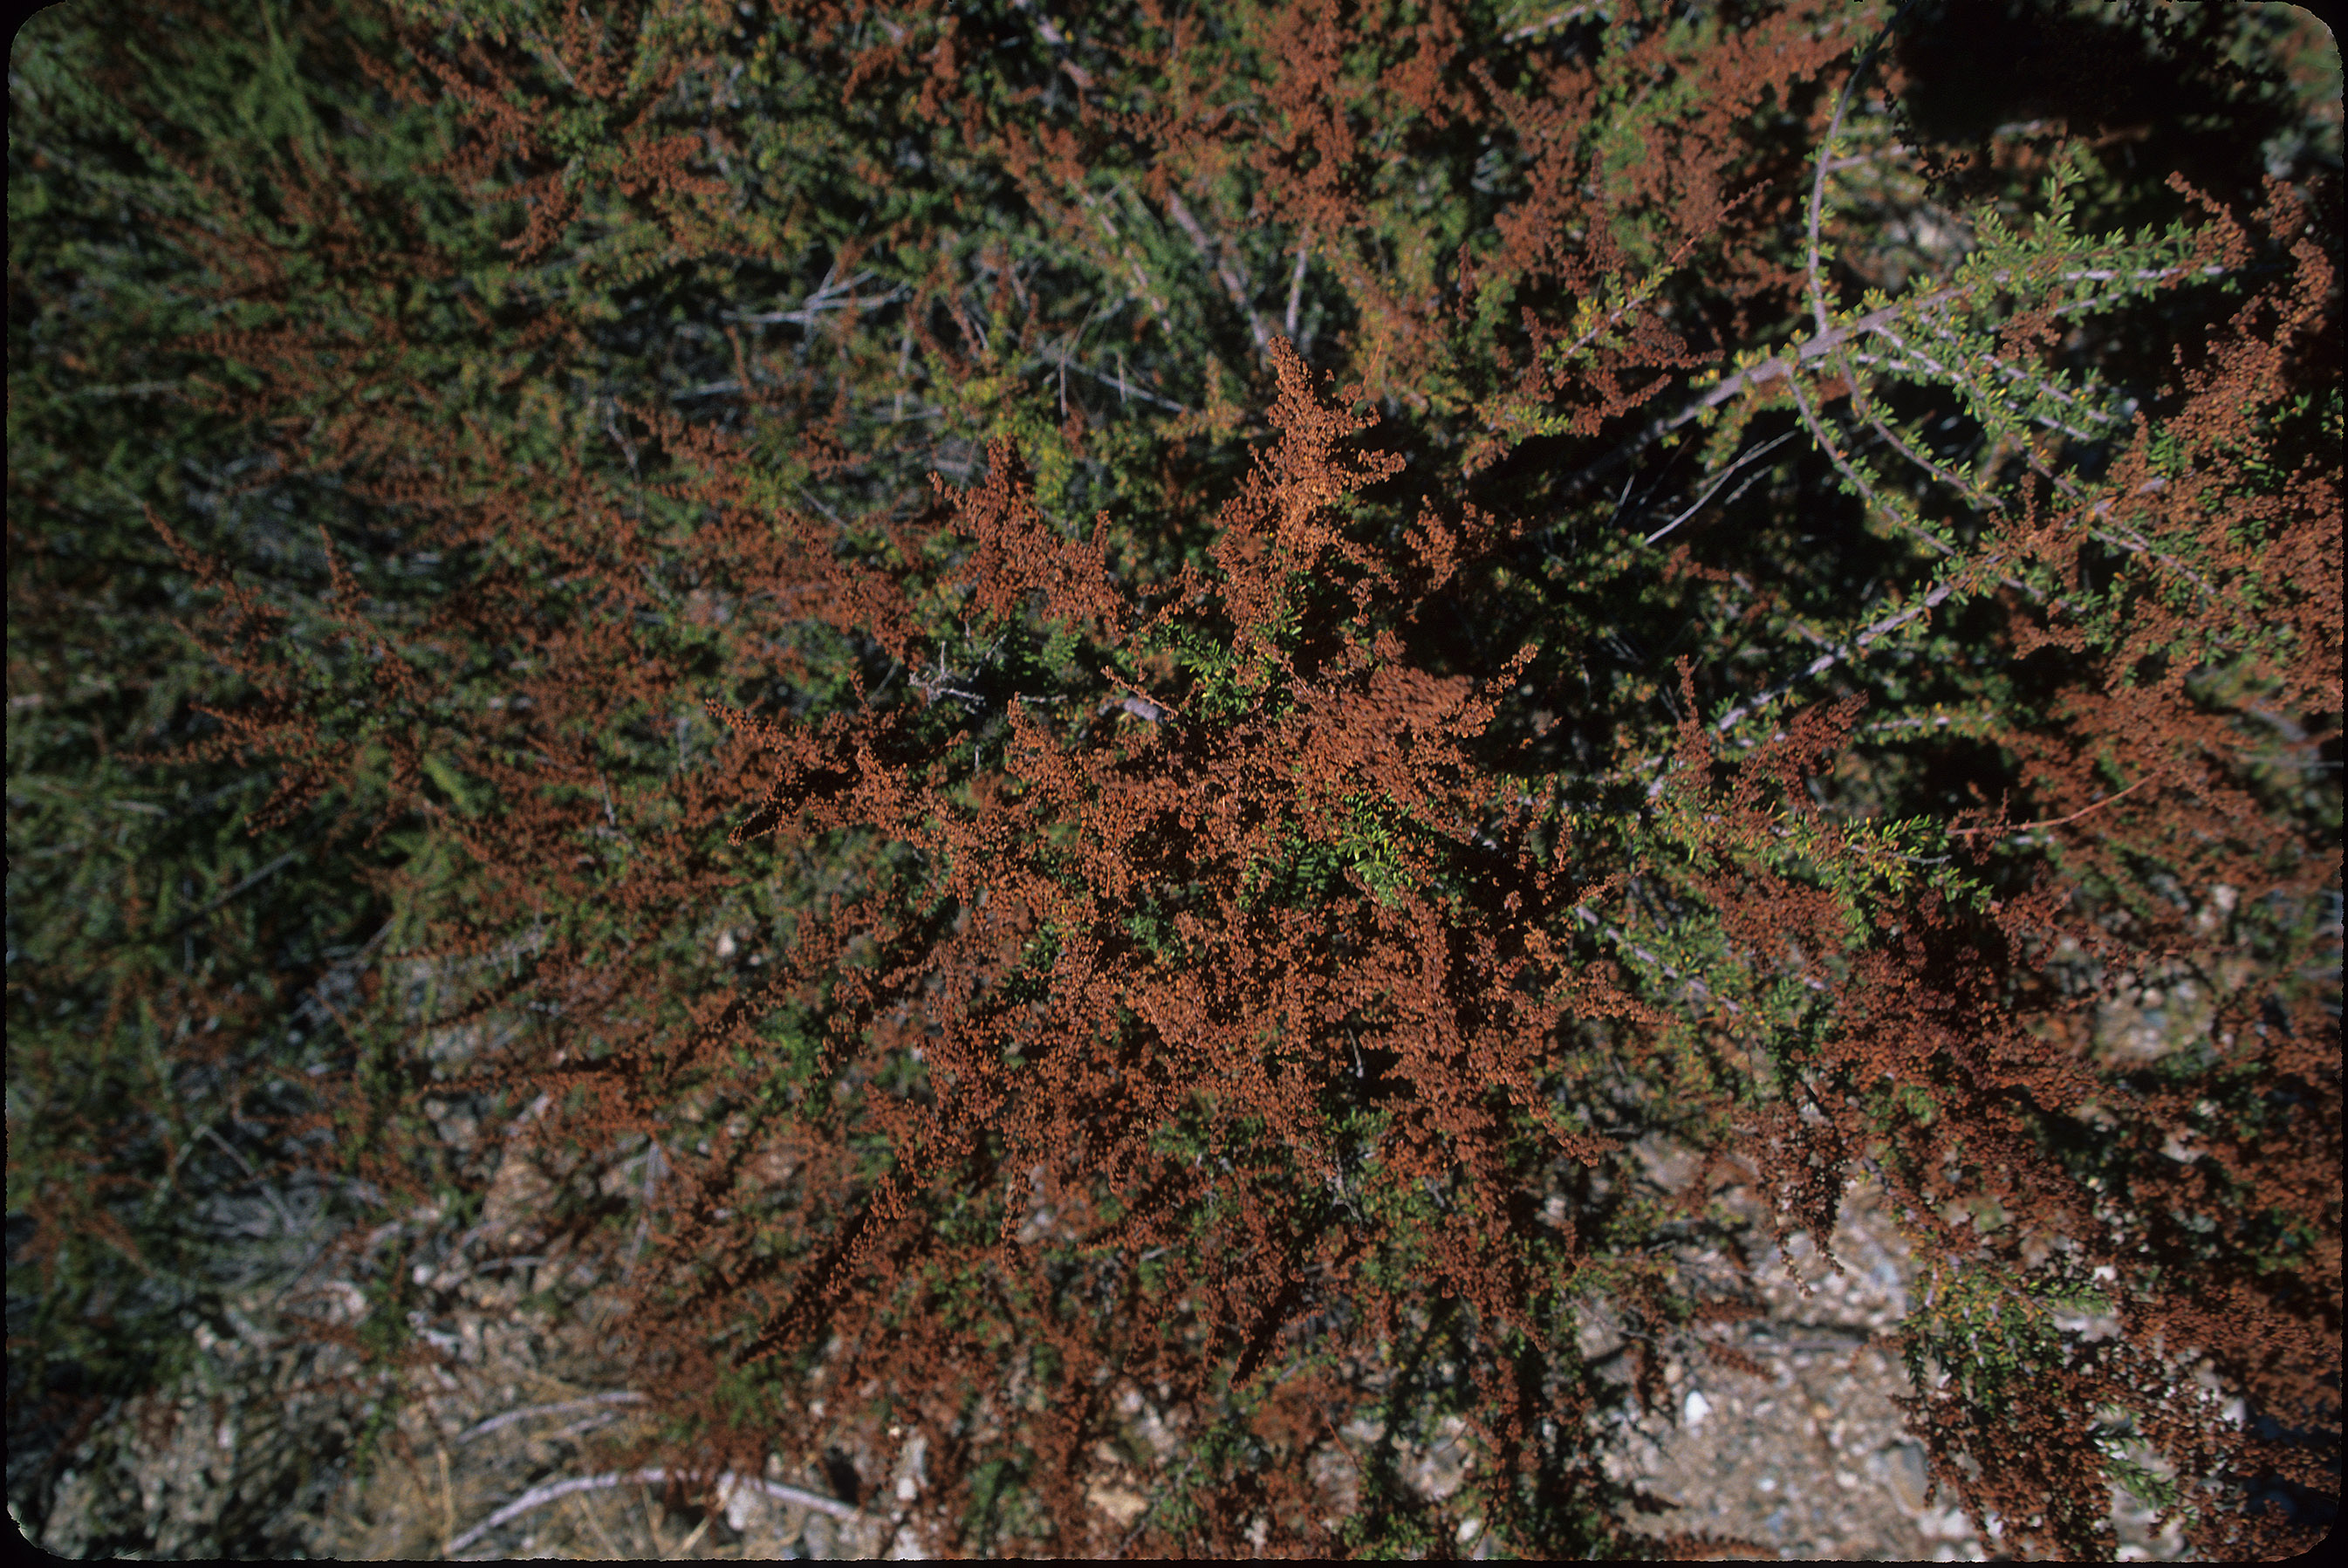
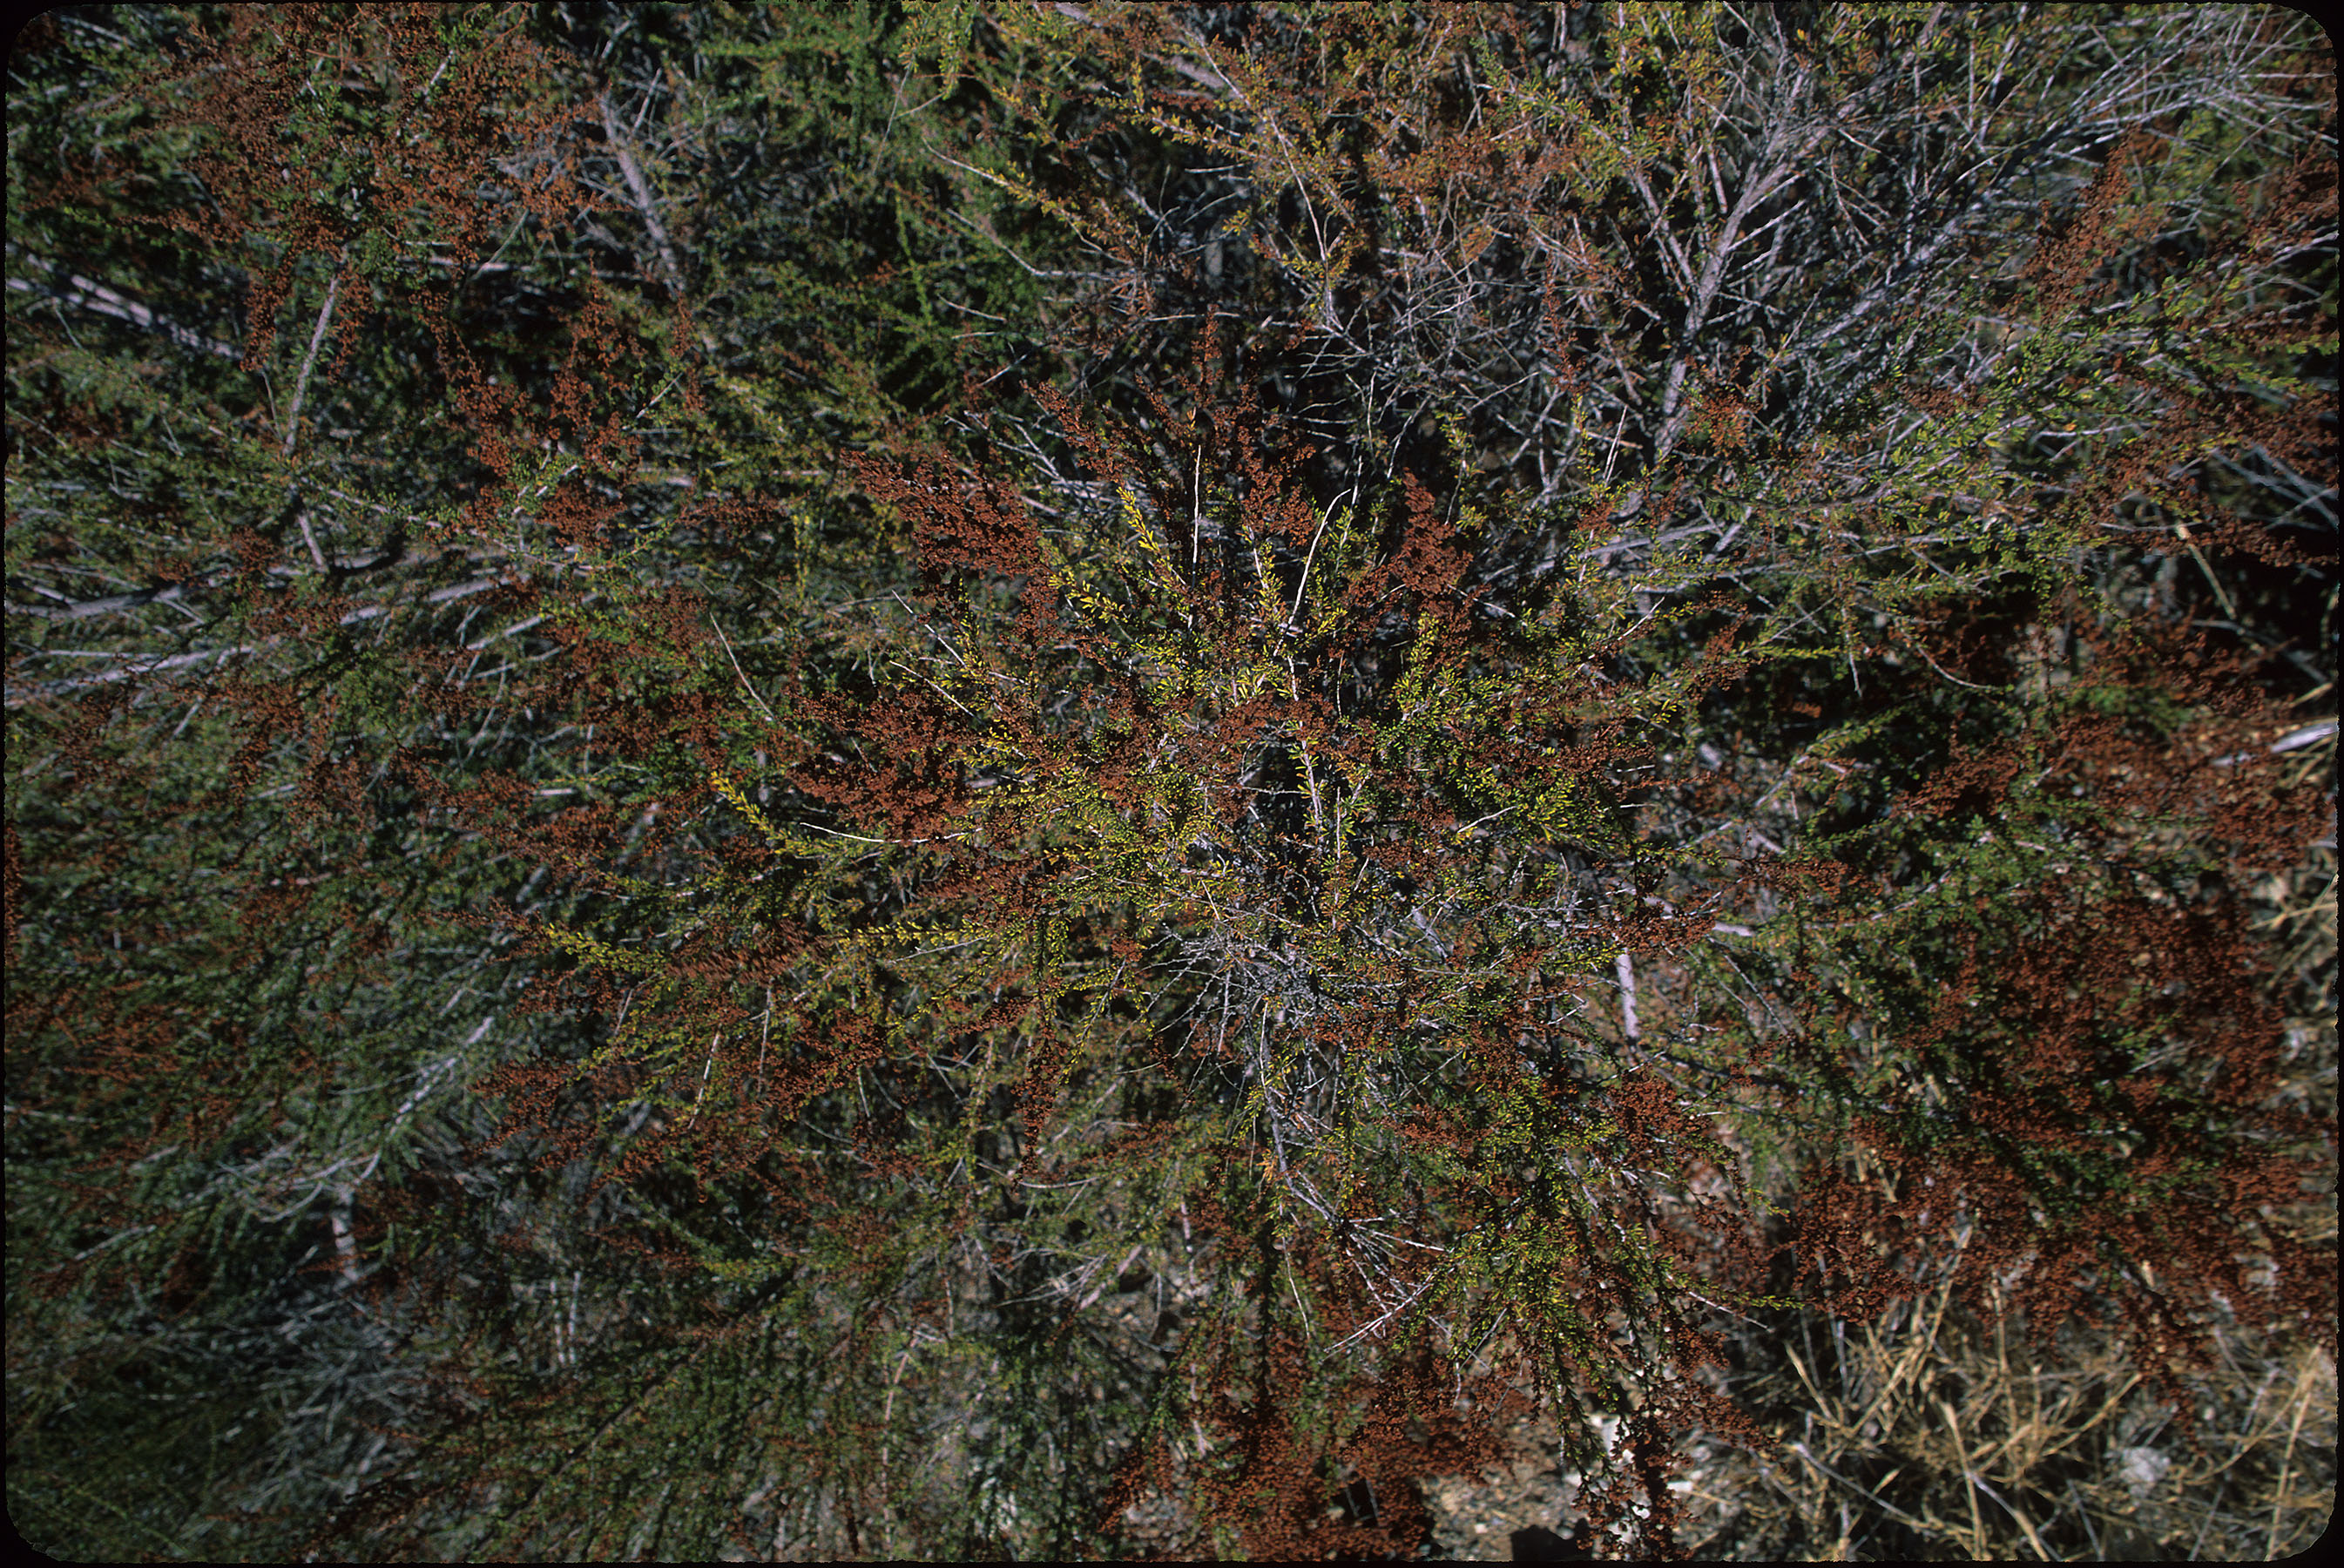
This spectrum is the average reflectance of 23 field measurements of several bushes of chamise (Adenostoma fasciculatum). The measurements were made at 2:00 pm local time on September 3, 2001. These spectra were made using an ASD FullRange (653) in reflectance mode, relative to a Spectralon reference panel. The bare fiber of the spectrometer was used to measure the reflectance spectra of the bushes. The bushes were sparsely-leaved by small light green leaves on branches that were light gray at their base and red near their tips. On average the field of view of the spectrometer included 30% dry, red "flower" heads, 35% green leaves, 20% shadows, 10% light gray stems, and 5% background soil/rock/litter. At the tip of each branch were small, dried, flower-like structures, red in color. The fiber optic cable was pointed at nadir and held 30 cm above the top of the bushes and moved around during the measurement. The instrument was programmed to record 6 second averages of reflectance (thus, each recorded spectrum was an average of 60 individual measurements). An average spectrum was computed from the recorded measurements and converted to absolute reflectance by multiplying by the reflectance spectrum of the Spectralon reference panel. Other samples of chamise were also measured at this location and are included in this spectral library, samples names: CA01-ADFA-2 to CA01-ADFA-3.
This spectrum was used in the following publication:
Swayze, G.A., Kokaly, R.F., Higgins, C.T., Clinkenbeard, J.P., Clark, R.N., Lowers, H.A, Sutley, and S.J., 2009,
Mapping potentially asbestos-bearing rocks using imaging spectroscopy, Geology Volume 37, pages 763-766.
http://dx.doi.org/10.1130/G30114A.1
IMAGE_OF_SAMPLE:
END_SAMPLE_DESCRIPTION.
COMPOSITIONAL_ANALYSIS_TYPE: None
COMPOSITION_DISCUSSION:
END_COMPOSITION_DISCUSSION.
TRACE_ELEMENT_ANALYSIS:
TRACE_ELEMENT_DISCUSSION:
END_TRACE_ELEMENT_DISCUSSION.
SPECTROSCOPIC_DISCUSSION:
END_SPECTROSCOPIC_DISCUSSION.
SPECTRAL_PURITY: 1a2_3_4_ # 1= 0.2-3, 2= 1.5-6, 3= 6-25, 4= 20-150 microns