
|
DOCUMENTATION_FORMAT: MINERAL
SAMPLE_ID: HS22.1B, HS22.2B, HS22.3B, HS22.4B
MINERAL_TYPE: Inosilicate
MINERAL: Actinolite (Amphibole group)
FORMULA: Ca2(Mg,Fe+2)5Si8O22(OH)2
FORMULA_HTML: Ca2(Mg,Fe+2)5Si8O22(OH)2
COLLECTION_LOCALITY: Chester, VT.
ORIGINAL_DONOR: Hunt and Salisbury Collection
CURRENT_SAMPLE_LOCATION: USGS Denver Spectroscopy Laboratory
ULTIMATE_SAMPLE_LOCATION: USGS Denver Spectroscopy Laboratory
SAMPLE_DESCRIPTION:
Forms a series with Tremolite and Ferro-actinolite.
Original spectrum published in:
Hunt, G.R., J.W. Salisbury, 1970, Visible and near-infrared spectra of minerals and rocks: I. Silicate minerals. Modern Geology, vol. 1, pp283-300, with the note: "The flattening of the spectral curve of the finest size range near 2 µm, which produces a cross-over of the spectra, is apparently due to a very slight contamination of the sample by opaque inclusions of pyrite (?)."
A spectrum of this sample is also published in: Clark, R.N., T.V.V. King, M. Klejwa, G. Swayze, and N. Vergo, 1990, High spectral resolution reflectance spectroscopy of minerals: J. Geophys Res., v. 95, 12653-12680, who noted that the sample is spectrally pure.
Grain size fractions are indicated by the extension after the sample number:
.1B = <5 µm
.2B = <74 µm
.3B = 74-250 µm
.4B = 250-1200 µm
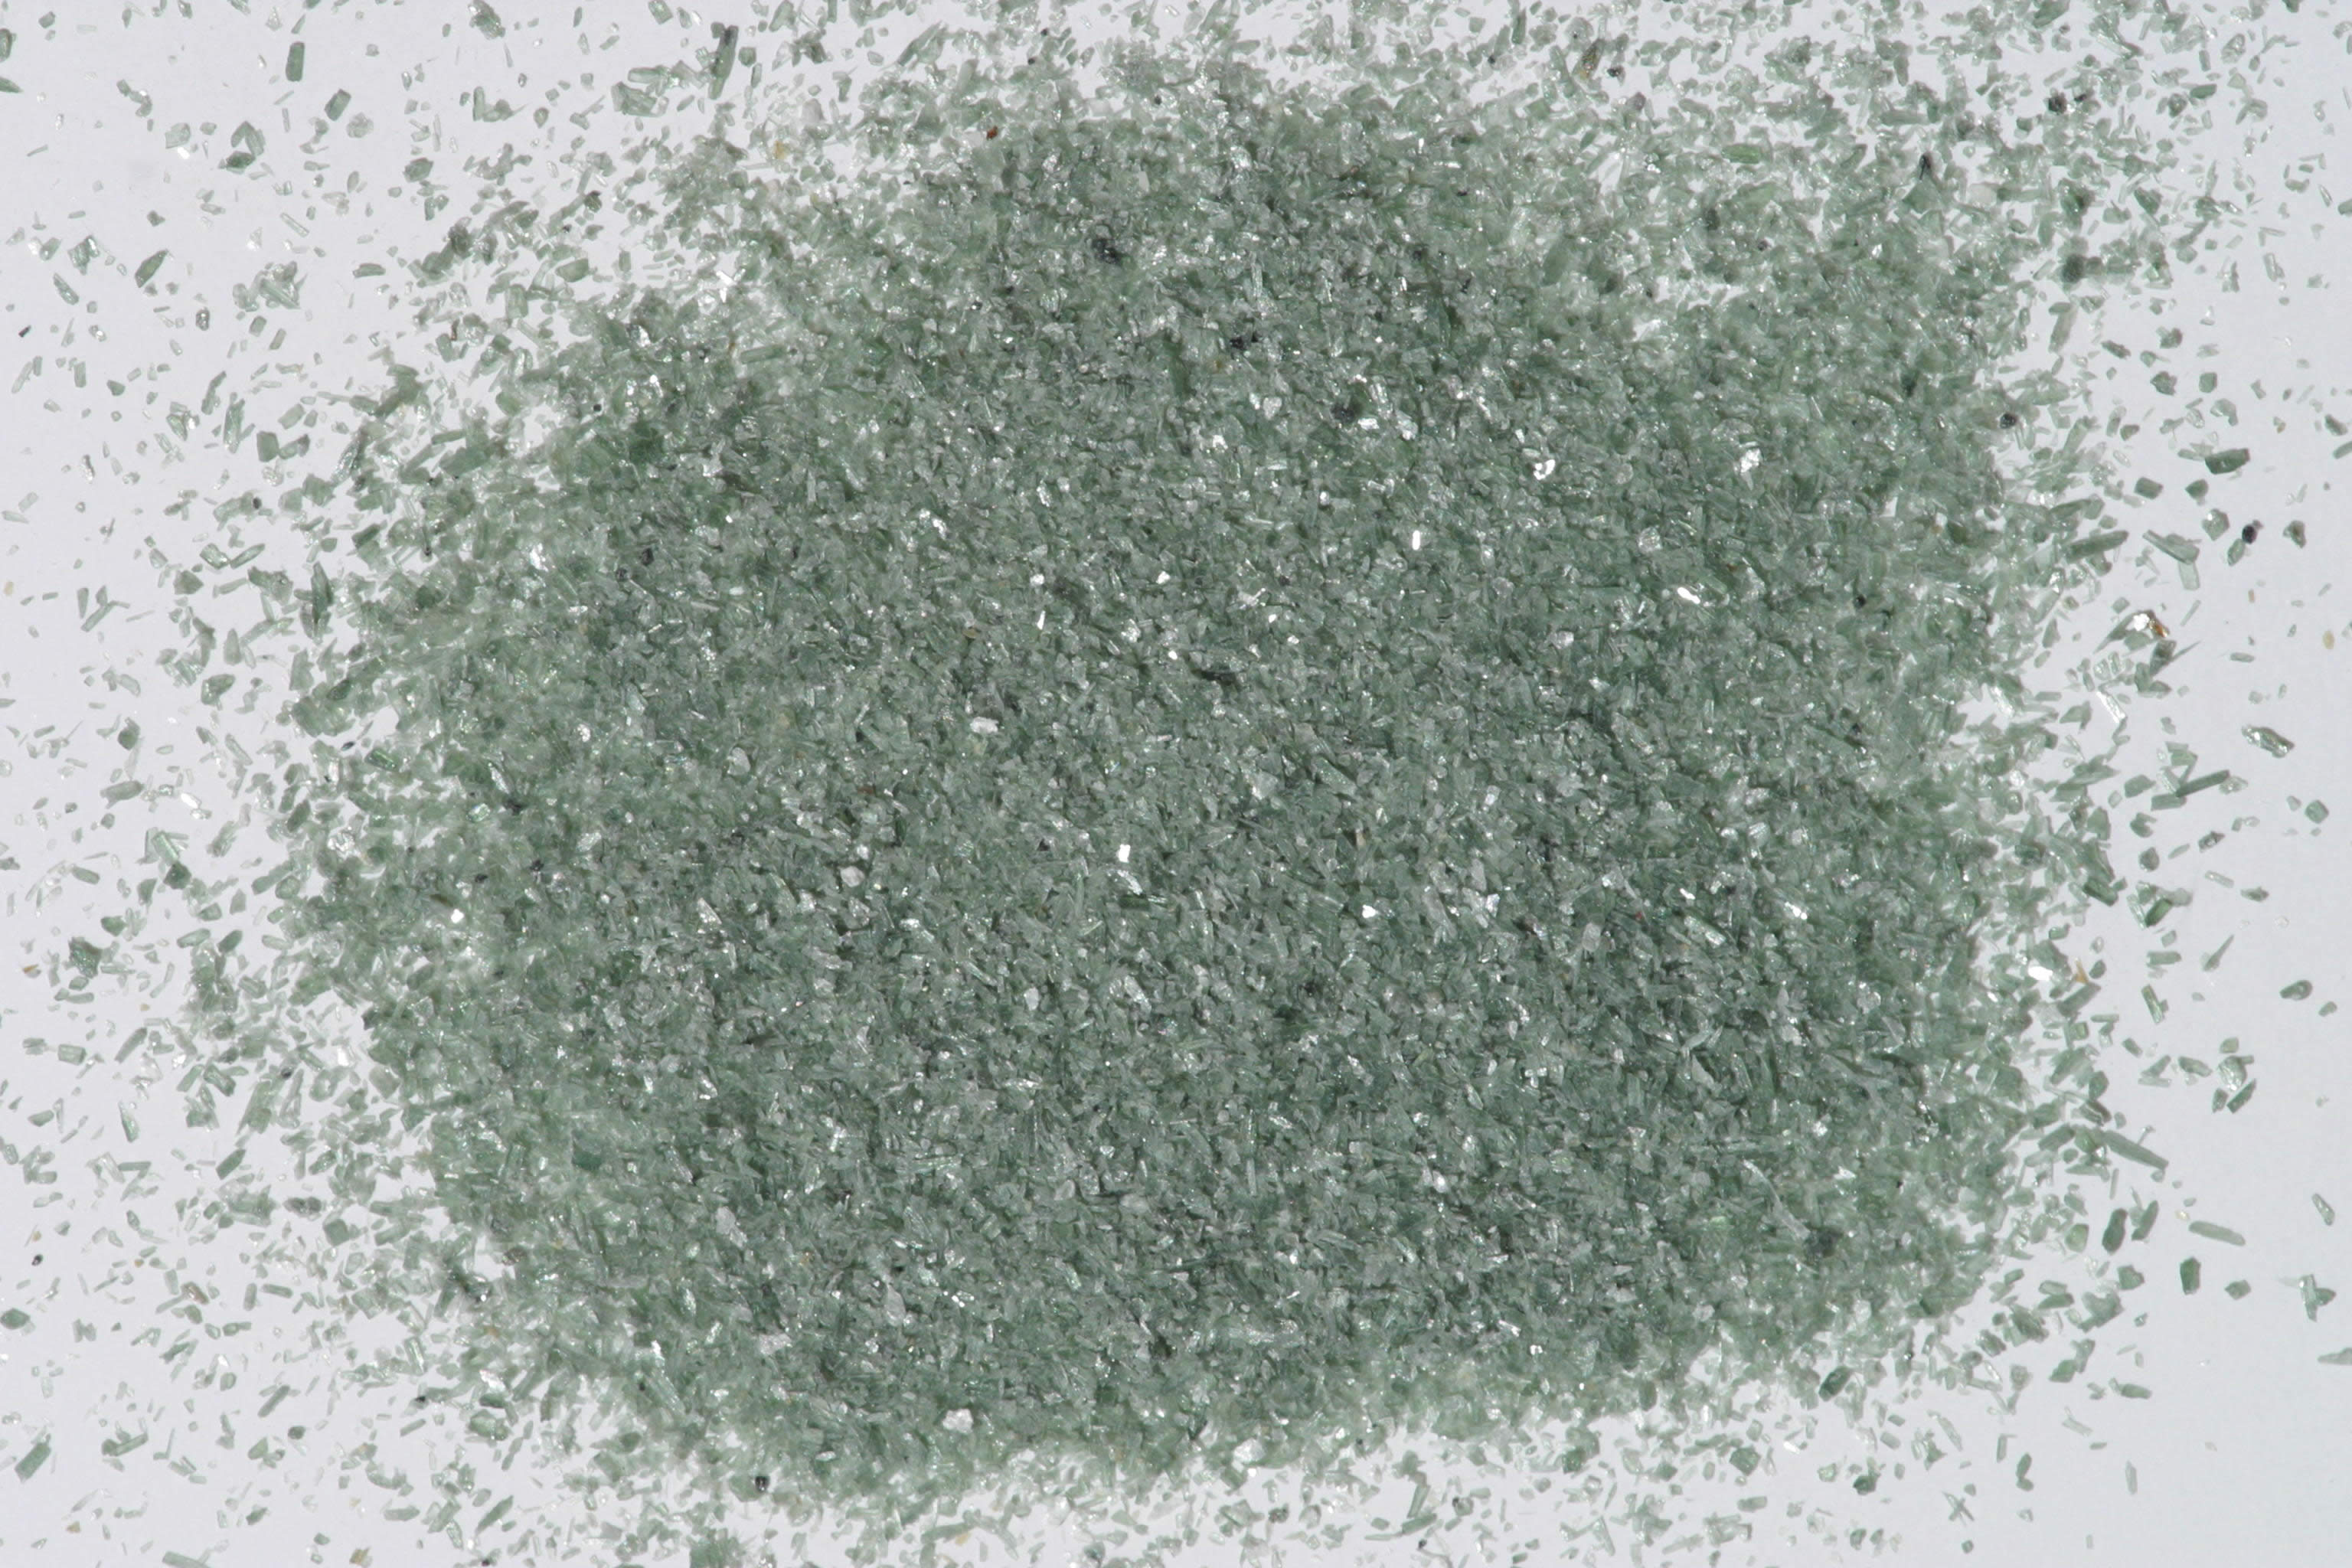
IMAGE_OF_SAMPLE:
END_SAMPLE_DESCRIPTION.
XRD_ANALYSIS:
40 kV - 30 mA, 7.3-9.5 keV
File: acHS22.out, *_mdi (smear mount on quartz plate)
References: Huebner's reference patterns
Found: Clinoamphibole, chlorite, trace possible talc
Comment: Excellent amphibole pattern closely matches that of a natural tremolite-actinolite. Insufficient number of chlorite reflections to determine polytype. Weak reflection at 9.2 Angstroms could be the strong basal reflection of talc, which commonly occurs with tremolite-actinolite.
J.S. Huebner, J. Pickrell, T. Schaefer, written communication 1994.
END_XRD_ANALYSIS.
COMPOSITIONAL_ANALYSIS_TYPE: EPMA # XRF, EPMA, ICP(Trace), WChem
| COMPOSITION KEYWORD |
Oxide ASCII |
Amount | Weight Percent, % |
Oxide html |
|---|---|---|---|---|
| COMPOSITION: | SiO2 | 54.53 | wt% | SiO2 |
| COMPOSITION: | TiO2 | 0.04 | wt% | TiO2 |
| COMPOSITION: | Al2O3 | 1.64 | wt% | Al2O3 |
| COMPOSITION: | Cr2O3 | 0.27 | wt% | Cr2O3 |
| COMPOSITION: | FeO | 5.46 | wt% | FeO |
| COMPOSITION: | MnO | 0.21 | wt% | MnO |
| COMPOSITION: | MgO | 21.69 | wt% | MgO |
| COMPOSITION: | CaO | 12.01 | wt% | CaO |
| COMPOSITION: | Na2O | 0.41 | wt% | Na2O |
| COMPOSITION: | K2O | 0.03 | wt% | K2O |
| COMPOSITION: | Total | 96.28 | wt% | |
| COMPOSITION: | O=Cl,F,S | wt% | #correction for Cl, F, S | |
| COMPOSITION: | New Total | wt% |
COMPOSITION_TRACE: None
COMPOSITION_DISCUSSION:
EM analysis by Gregg A. Swayze at USGS Branch of Geophysics, Denver, indicates stoichiometric actinolite.
END_COMPOSITION_DISCUSSION.
MICROSCOPIC_EXAMINATION:
Optical examination give the following mineral mode:
91.5 vol% actinolite
8.0 vol% wh. mica or calcite
0.5 vol% opaque inclusions
avg. grain size = 74-250µm
Mostly pure, highly fractured green actinolite grains (occasionally some with opaque inclusions). Platy translucent mica? grains intermixed with actinolite. Continuous grain size distribution with little coating of larger grains by smaller grains. G. Swayze
END_MICROSCOPIC_EXAMINATION.
SPECTROSCOPIC_DISCUSSION:
END_SPECTROSCOPIC_DISCUSSION.
SPECTRAL_PURITY: 1b2_3_4_ # HS22.1B # 1= 0.2-3, 2= 1.5-6, 3= 6-25, 4= 20-150 microns
SPECTRAL_PURITY: 1b2_3_4_ # HS22.2B # 1= 0.2-3, 2= 1.5-6, 3= 6-25, 4= 20-150 microns
SPECTRAL_PURITY: 1b2b3b4b # HS22.3B # 1= 0.2-3, 2= 1.5-6, 3= 6-25, 4= 20-150 microns
SPECTRAL_PURITY: 1b2_3_4_ # HS22.4B # 1= 0.2-3, 2= 1.5-6, 3= 6-25, 4= 20-150 microns